emooki
HomePrice mapTransactions
🇬🇧 English🇫🇷 Français🇩🇪 Deutsch🇪🇸 Español🇮🇹 Italiano

Real estate price map


Real estate price map in the municipality of Ventalon en Cévennes.

Lozère (48)
Ventalon en Cévennes

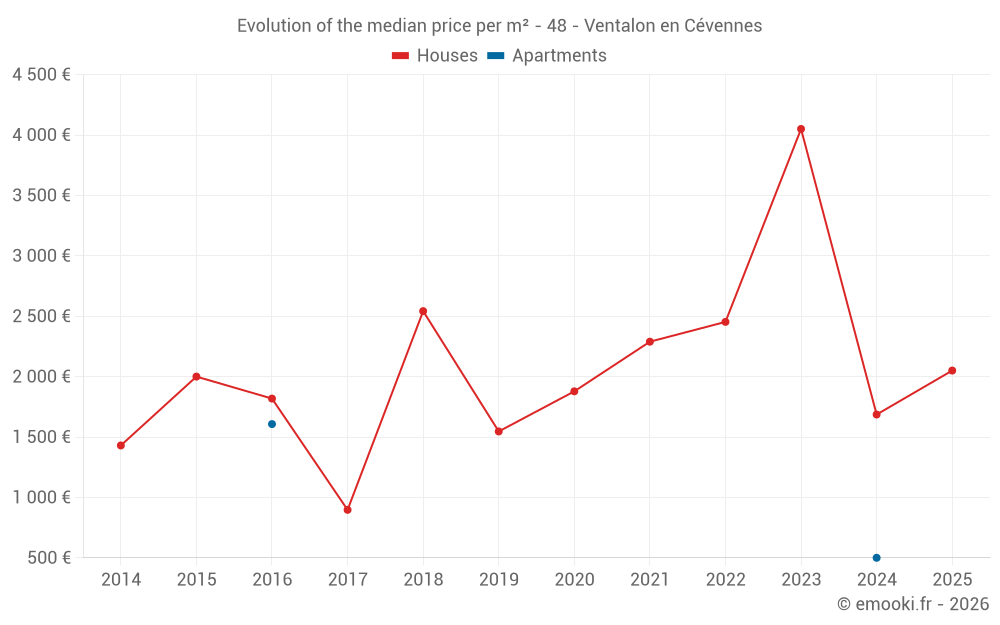
Median price of real estate
in the municipality of Ventalon en Cévennes

HousesHouses
2 520  /m²
1-23-45-67-89-10
Reliability 6/10
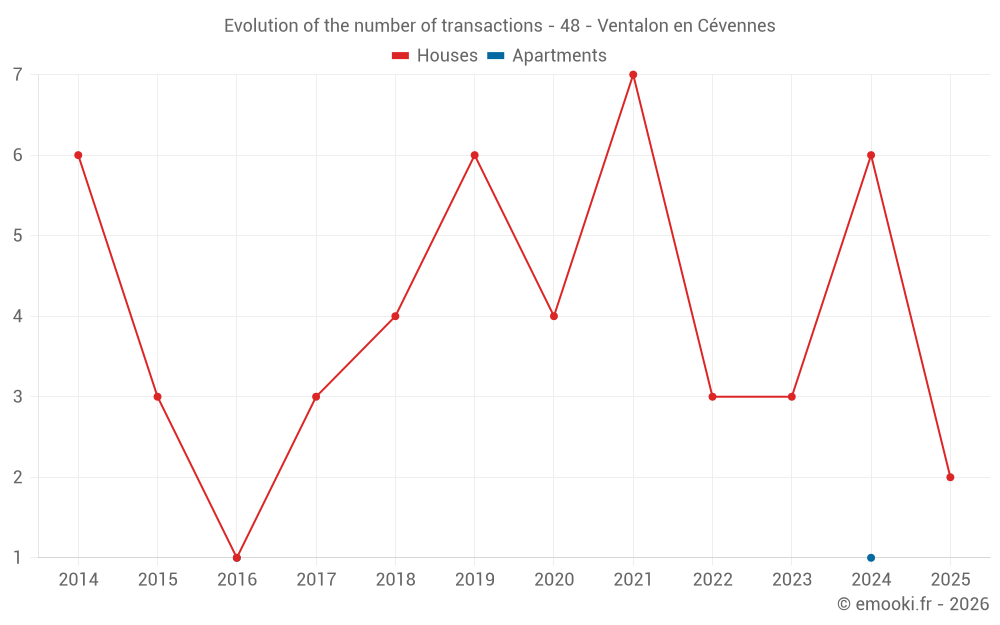
Median price on the 12 transactions of the last 36 months.
from 1 109 to
3 127  /m²
60% of transactions from the 2nd to the 8th deciles.
ApartmentsApartments
1 054  /m²
1-23-45-67-89-10
Reliability 1/10
Median price on the 2 transactions of the last 120 months.
DwellingsDwellings
2 500  /m²
1-23-45-67-89-10
Reliability 6/10
Median price on the 13 transactions of the last 36 months.
from 836 to
3 111  /m²
60% of transactions from the 2nd to the 8th deciles.
HousesEvolution of the price per m² of houses since...
1 year
--
2 years
--
3 years
--
4 years
--
5 years
--
6 years
--
7 years
--
8 years
--
9 years
--
10 years
--
11 years
--
ApartmentsEvolution of the price per m² of apartments since...
1 year
--
2 years
--
3 years
--
4 years
--
5 years
--
6 years
--
7 years
--
8 years
--
9 years
--
10 years
--
11 years
--

Yearly evolution

Evolution of the median price per m²

Evolution of the number of transactions

Warning, last year incomplete. Projections made based on the proportions between semesters of the previous year at the departmental/national level and by type of property.

Yearly data

Descending order
Year
Houses
house
transactions
Houses
house
Price per m²
Apartments
apt.
transactions
Apartments
apt.
Price per m²
2025
2
2 050 
0
--- 
2024
6
1 686 
1
500 
2023
3
4 050 
0
--- 
2022
3
2 453 
0
--- 
2021
7
2 289 
0
--- 
2020
4
1 878 
0
--- 
2019
6
1 546 
0
--- 
2018
4
2 542 
0
--- 
2017
3
897 
0
--- 
2016
1
1 818 
1
1 607 
2015
3
2 000 
0
--- 
2014
6
1 430 
0
--- 

Analysis

Structure of prices per m²

Values of price percentiles per m² over the periods used for the estimated price of each type of property.

Structure of transaction amounts

Values of transaction amounts percentiles over the periods used for the estimated price of each type of property.

Transaction amounts and prices per m² by percentile

Ascending order
Percentile
Houses
house
Price per m²
Houses
house
Transaction amount
Apartments
apt.
Price per m²
Apartments
apt.
Transaction amount
10th percentile
744 
69 654 
611 
34 875 
20th percentile
1 109 
88 400 
721 
49 750 
30th percentile
1 733 
164 K
832 
64 625 
40th percentile
2 412 
170 K
943 
79 500 
50th percentile
2 520 
173 K
1 054 
94 375 
60th percentile
2 596 
181 K
1 164 
109 K
70th percentile
2 933 
231 K
1 275 
124 K
80th percentile
3 127 
277 K
1 386 
139 K
90th percentile
3 959 
384 K
1 496 
154 K

National and departmental comparison

Evolution of the median price per m² of houses

Evolution of the median price per m² of apartments

Quarterly evolution

Evolution of the median price per m²

Evolution of the number of transactions

Quarterly data

Descending order
Quarter
Houses
house
transactions
Houses
house
Price per m²
Apartments
apt.
transactions
Apartments
apt.
Price per m²
2025 Q2
1
1 467 
0
--- 
2025 Q1
1
2 633 
0
--- 
2024 Q4
4
2 426 
0
--- 
2024 Q3
1
714 
0
--- 
2024 Q2
1
1 019 
0
--- 
2024 Q1
0
--- 
1
500 
2023 Q4
1
4 800 
0
--- 
2023 Q2
1
4 050 
0
--- 
2023 Q1
1
3 061 
0
--- 
2022 Q4
1
2 540 
0
--- 
2022 Q2
2
1 934 
0
--- 
2021 Q4
2
1 436 
0
--- 
2021 Q2
2
2 403 
0
--- 
2021 Q1
3
2 289 
0
--- 
2020 Q4
1
1 802 
0
--- 
2020 Q2
2
1 566 
0
--- 
2020 Q1
1
1 955 
0
--- 
2019 Q4
2
1 520 
0
--- 
2019 Q3
3
1 442 
0
--- 
2019 Q2
1
5 119 
0
--- 
2018 Q3
1
1 178 
0
--- 
2018 Q2
2
2 653 
0
--- 
2018 Q1
1
2 800 
0
--- 
2017 Q3
1
600 
0
--- 
2017 Q1
2
1 022 
0
--- 
2016 Q3
1
1 818 
0
--- 
2016 Q2
0
--- 
1
1 607 
2015 Q4
2
2 056 
0
--- 
2015 Q1
1
395 
0
--- 
2014 Q4
1
1 509 
0
--- 
2014 Q3
1
1 351 
0
--- 
2014 Q2
2
1 158 
0
--- 
2014 Q1
2
1 832 
0
--- 

Lozère (48)

Most expensive cities

City
name
Descending orderHouses
house
Price per m²
2 306 
2 116 
2 105 
City
name
Descending orderApartments
apt.
Price per m²
2 572 
1 806 
1 659 
1 603 
1 591 
1 550 
1 542 
1 531 
1 507 

Least expensive cities

City
name
Ascending orderHouses
house
Price per m²
511 
578 
622 
627 
642 
672 
698 
700 
City
name
Ascending orderApartments
apt.
Price per m²
184 
187 
243 
286 
336 
353 
357