emooki
HomePrice mapTransactions
🇬🇧 English🇫🇷 Français🇩🇪 Deutsch🇪🇸 Español🇮🇹 Italiano

Real estate price map


Real estate price map by city in the Lot-et-Garonne department, click on a city to see prices by section. Download as image

Department 47

Price m² Lot-et-Garonne

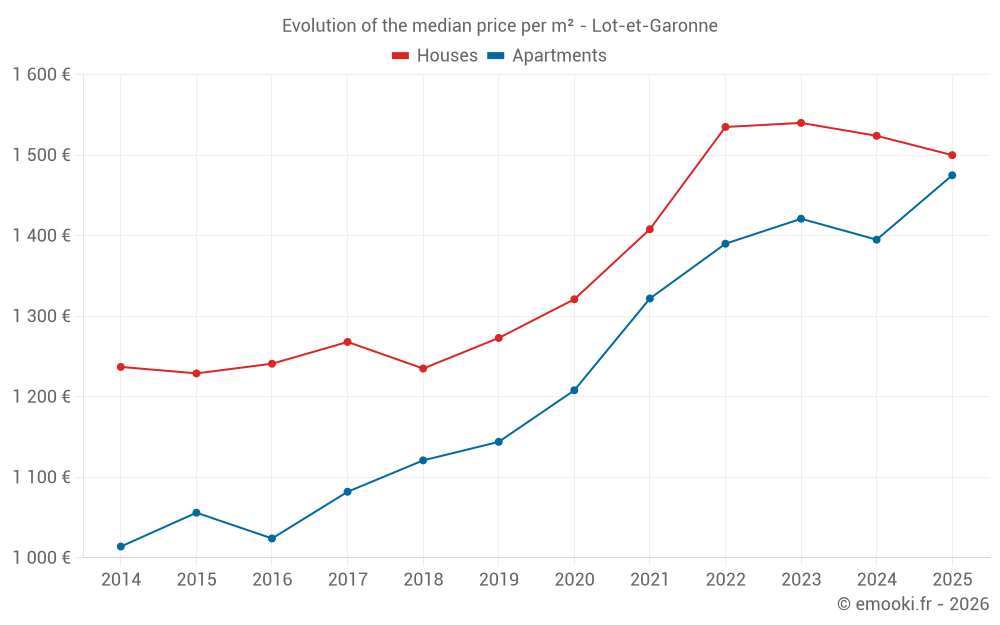
Median price of real estate
in the Lot-et-Garonne department

HousesHouses
1 454  /m²
1-23-45-67-89-10
Reliability 10/10
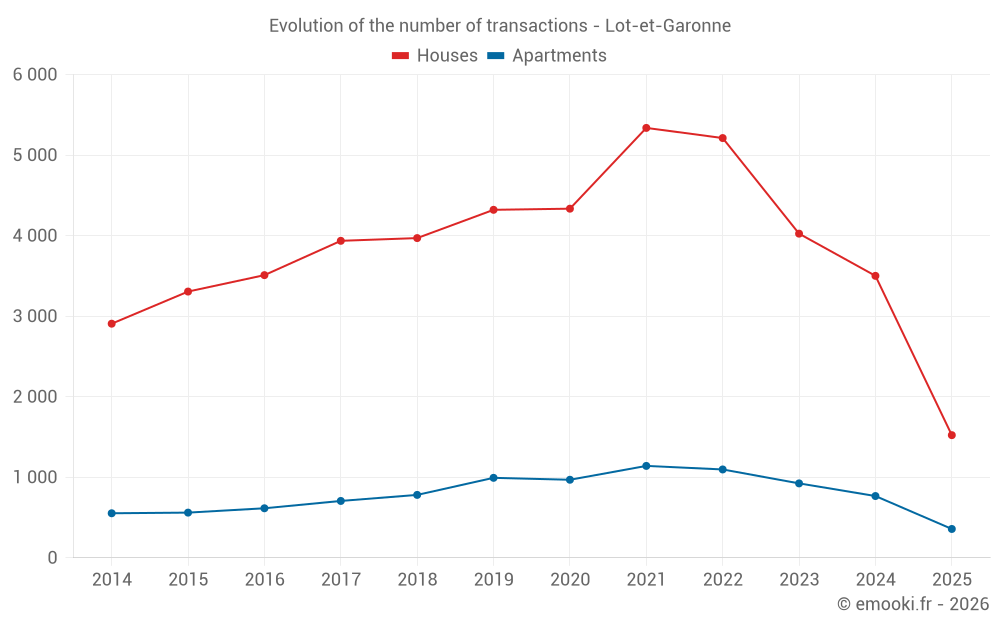
Median price on the 664 transactions of the last 3 months.
from 828 to
2 126  /m²
60% of transactions from the 2nd to the 8th deciles.
ApartmentsApartments
1 450  /m²
1-23-45-67-89-10
Reliability 10/10
Median price on the 165 transactions of the last 3 months.
from 993 to
1 894  /m²
60% of transactions from the 2nd to the 8th deciles.
DwellingsDwellings
1 453  /m²
1-23-45-67-89-10
Reliability 10/10
Median price on the 829 transactions of the last 3 months.
from 866 to
2 078  /m²
60% of transactions from the 2nd to the 8th deciles.
HousesEvolution of the price per m² of houses since...
1 year
-1.6%
2 years
-2.6%
3 years
-2.3%
4 years
+6.5%
5 years
+14%
6 years
+18%
7 years
+21%
8 years
+18%
9 years
+21%
10 years
+22%
11 years
+21%
The price per m² of houses has decreased by 2.6% since 2 years, but it has increased by 22% in 10 years.
ApartmentsEvolution of the price per m² of apartments since...
1 year
+5.7%
2 years
+3.8%
3 years
+6.1%
4 years
+12%
5 years
+22%
6 years
+29%
7 years
+32%
8 years
+36%
9 years
+44%
10 years
+40%
11 years
+45%

Yearly evolution

Evolution of the median price per m²

Evolution of the median price per m² - Lot-et-Garonne

Evolution of the number of transactions

Warning, last year incomplete. Projections made based on the proportions between semesters of the previous year at the departmental/national level and by type of property.

Evolution of the number of transactions - Lot-et-Garonne

Yearly data

Descending order
Year
Houses
house
transactions
Houses
house
Price per m²
Apartments
apt.
transactions
Apartments
apt.
Price per m²
2025
1 523
1 500 
358
1 475 
2024
3 501
1 524 
767
1 395 
2023
4 025
1 540 
924
1 421 
2022
5 212
1 535 
1 097
1 390 
2021
5 338
1 408 
1 141
1 322 
2020
4 335
1 321 
969
1 208 
2019
4 321
1 273 
993
1 144 
2018
3 970
1 235 
781
1 121 
2017
3 936
1 268 
706
1 082 
2016
3 510
1 241 
615
1 024 
2015
3 306
1 229 
561
1 056 
2014
2 907
1 237 
553
1 014 

Analysis

Structure of prices per m²

Values of price percentiles per m² over the periods used for the estimated price of each type of property.

Structure of transaction amounts

Values of transaction amounts percentiles over the periods used for the estimated price of each type of property.

Transaction amounts and prices per m² by percentile

Ascending order
Percentile
Houses
house
Price per m²
Houses
house
Transaction amount
Apartments
apt.
Price per m²
Apartments
apt.
Transaction amount
10th percentile
541 
53 570 
804 
34 000 
20th percentile
828 
78 900 
993 
47 900 
30th percentile
1 045 
98 000 
1 127 
60 000 
40th percentile
1 223 
122 K
1 343 
68 000 
50th percentile
1 454 
140 K
1 450 
79 000 
60th percentile
1 667 
160 K
1 555 
90 832 
70th percentile
1 888 
187 K
1 764 
112 K
80th percentile
2 126 
220 K
1 894 
134 K
90th percentile
2 422 
288 K
2 239 
173 K

Quarterly evolution

Evolution of the median price per m²

Evolution of the number of transactions

Quarterly data

Descending order
Quarter
Houses
house
transactions
Houses
house
Price per m²
Apartments
apt.
transactions
Apartments
apt.
Price per m²
2025 Q2
664
1 454 
165
1 450 
2025 Q1
859
1 527 
193
1 500 
2024 Q4
1 007
1 507 
218
1 396 
2024 Q3
967
1 589 
192
1 440 
2024 Q2
818
1 438 
197
1 308 
2024 Q1
709
1 543 
160
1 406 
2023 Q4
944
1 444 
213
1 411 
2023 Q3
985
1 592 
212
1 433 
2023 Q2
1 047
1 552 
251
1 400 
2023 Q1
1 049
1 547 
248
1 451 
2022 Q4
1 233
1 562 
270
1 539 
2022 Q3
1 405
1 591 
283
1 417 
2022 Q2
1 384
1 516 
290
1 327 
2022 Q1
1 190
1 472 
254
1 342 
2021 Q4
1 447
1 449 
272
1 390 
2021 Q3
1 522
1 434 
338
1 306 
2021 Q2
1 326
1 333 
278
1 284 
2021 Q1
1 043
1 413 
253
1 291 
2020 Q4
1 440
1 347 
274
1 259 
2020 Q3
1 097
1 365 
241
1 143 
2020 Q2
897
1 286 
215
1 128 
2020 Q1
901
1 277 
239
1 232 
2019 Q4
1 213
1 296 
275
1 171 
2019 Q3
1 217
1 269 
259
1 154 
2019 Q2
985
1 288 
256
1 113 
2019 Q1
906
1 222 
203
1 113 
2018 Q4
1 069
1 259 
218
1 130 
2018 Q3
1 118
1 269 
194
1 132 
2018 Q2
942
1 212 
207
1 125 
2018 Q1
841
1 176 
162
1 088 
2017 Q4
1 045
1 253 
148
1 106 
2017 Q3
1 062
1 287 
181
1 125 
2017 Q2
952
1 232 
199
1 081 
2017 Q1
877
1 290 
178
1 030 
2016 Q4
941
1 225 
148
974 
2016 Q3
1 003
1 270 
165
1 063 
2016 Q2
864
1 214 
161
1 050 
2016 Q1
702
1 246 
141
1 019 
2015 Q4
915
1 229 
134
1 071 
2015 Q3
927
1 250 
152
1 064 
2015 Q2
814
1 165 
143
1 031 
2015 Q1
650
1 275 
132
988 
2014 Q4
817
1 200 
140
1 064 
2014 Q3
754
1 238 
137
978 
2014 Q2
694
1 259 
144
1 006 
2014 Q1
642
1 257 
132
1 020 

Lot-et-Garonne (47)

Most expensive cities

City
name
Descending orderHouses
house
Price per m²
2 454 
2 406 
2 282 
2 209 
2 156 
2 108 
2 104 
2 101 
2 074 
City
name
Descending orderApartments
apt.
Price per m²
5 176 
3 940 
2 158 
1 949 
1 929 
1 875 

Least expensive cities

City
name
Ascending orderHouses
house
Price per m²
657 
708 
734 
750 
759 
764 
843 
846 
City
name
Ascending orderApartments
apt.
Price per m²
114 
155 
168 
316