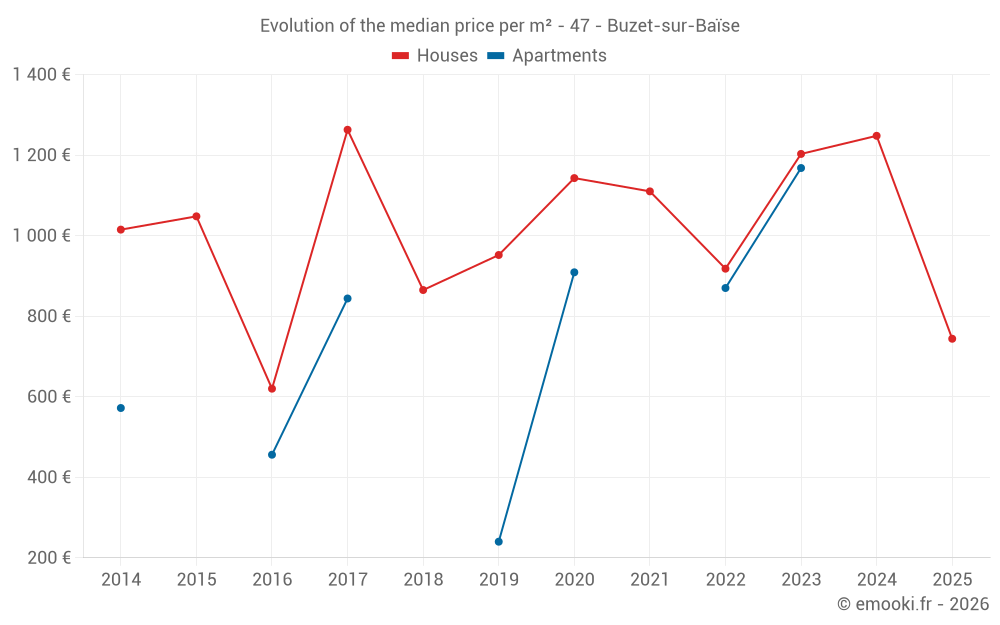
Median price of real estate
in the municipality of Buzet-sur-Baïse
Houses
1 220 € /m²
Reliability 7/10
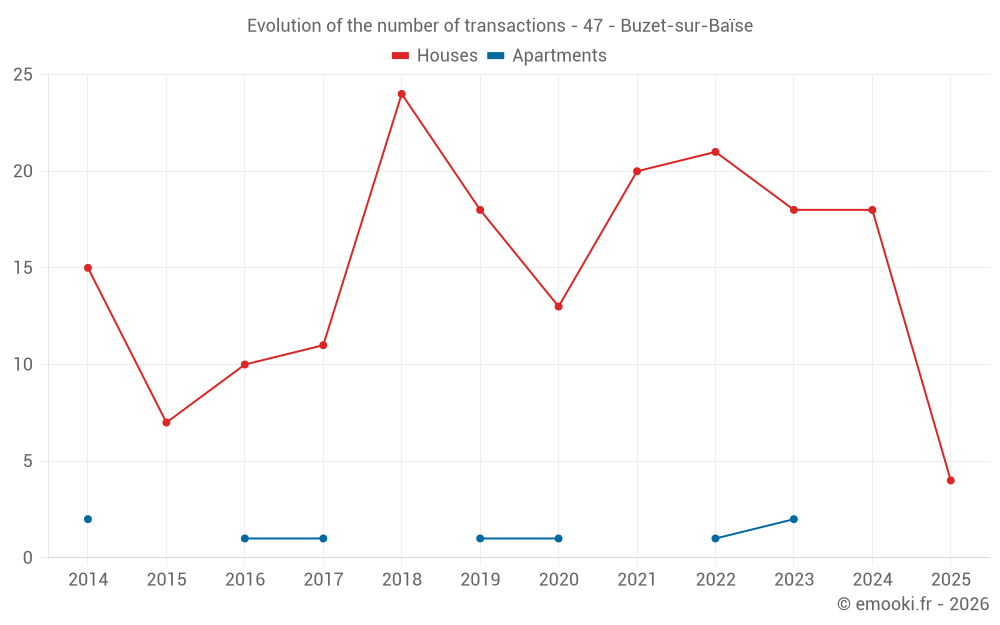
Median price on the 31 transactions of the last 24 months.
from 585 to
1 591 € /m²
1 591 € /m²
60% of transactions from the 2nd to the 8th deciles.
Apartments
870 € /m²
Reliability 2/10
Median price on the 5 transactions of the last 96 months.
Dwellings
1 220 € /m²
Reliability 7/10
Median price on the 31 transactions of the last 24 months.
from 585 to
1 591 € /m²
1 591 € /m²
60% of transactions from the 2nd to the 8th deciles.