emooki
HomePrice mapTransactions
🇬🇧 English🇫🇷 Français🇩🇪 Deutsch🇪🇸 Español🇮🇹 Italiano

Real estate price map


Real estate price map in the municipality of Fumel, choose a section to see transactions by parcel.

Lot-et-Garonne (47)

Fumel - Real estate price m²

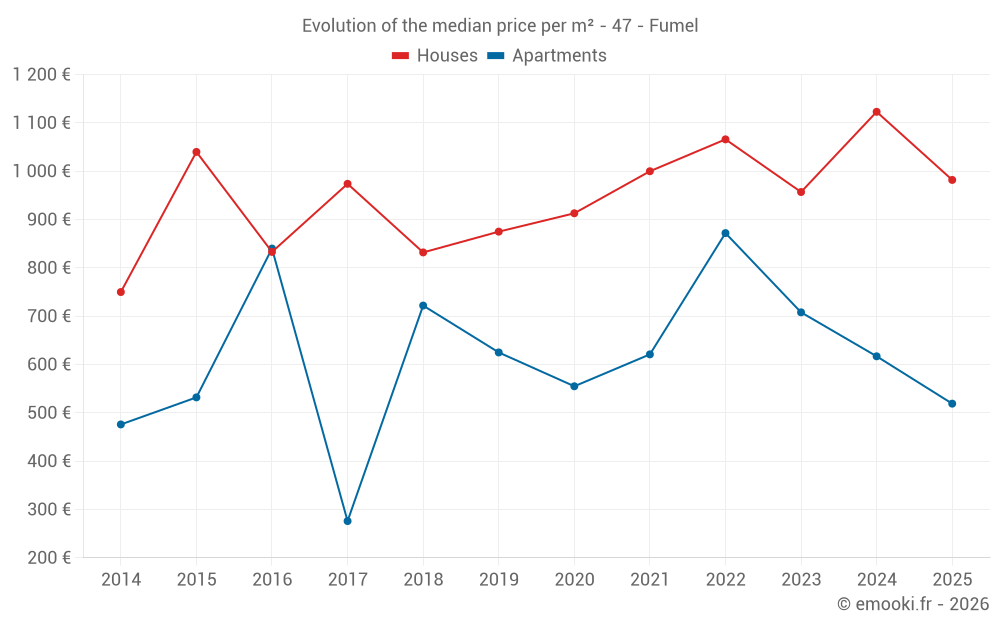
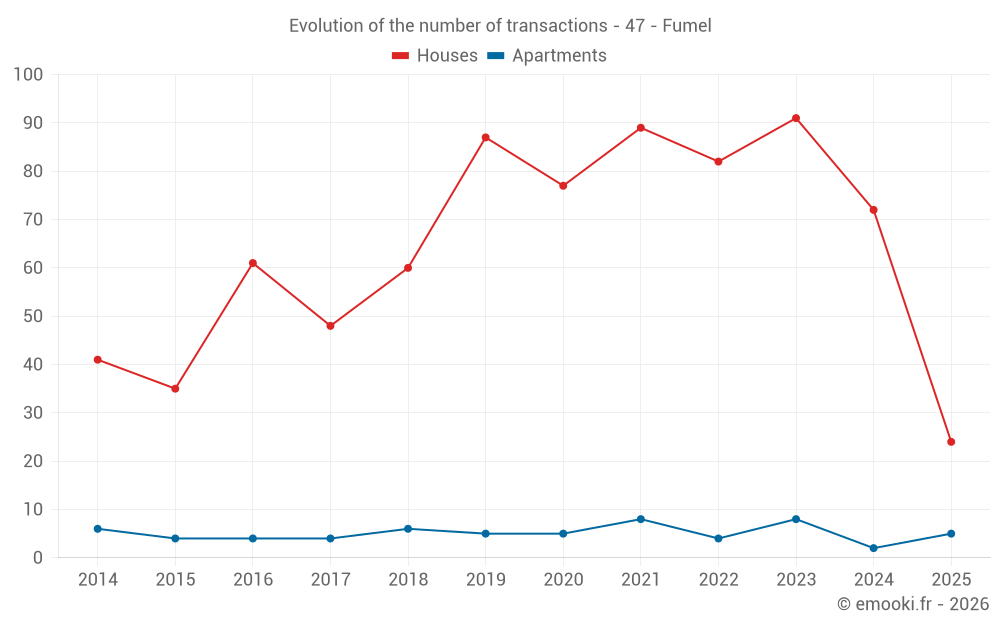
Median price of real estate
in the municipality of Fumel

HousesHouses
982  /m²
1-23-45-67-89-10
Reliability 9/10
Median price on the 24 transactions of the last 6 months.
from 611 to
1 915  /m²
60% of transactions from the 2nd to the 8th deciles.
ApartmentsApartments
694  /m²
1-23-45-67-89-10
Reliability 6/10
Median price on the 16 transactions of the last 36 months.
from 519 to
841  /m²
60% of transactions from the 2nd to the 8th deciles.
DwellingsDwellings
825  /m²
1-23-45-67-89-10
Reliability 9/10
Median price on the 29 transactions of the last 6 months.
from 516 to
1 876  /m²
60% of transactions from the 2nd to the 8th deciles.
HousesEvolution of the price per m² of houses since...
1 year
-13%
2 years
+2.6%
3 years
-7.9%
4 years
-1.8%
5 years
+7.6%
6 years
+12%
7 years
+18%
8 years
+0.8%
9 years
+18%
10 years
-5.6%
11 years
+31%
The price per m² of houses has decreased by 13% since 1 year, but it has increased by 31% in 11 years.
ApartmentsEvolution of the price per m² of apartments since...
1 year
--
2 years
-27%
3 years
-40%
4 years
-16%
5 years
-6.5%
6 years
-17%
7 years
-28%
8 years
+88%
9 years
-38%
10 years
-2.4%
11 years
+9%
The price per m² of apartments has decreased by 40% since 3 years, but it has increased by 88% in 8 years.

Yearly evolution

Evolution of the median price per m²

Evolution of the median price per m² - 47 - Fumel

Evolution of the number of transactions

Warning, last year incomplete. Projections made based on the proportions between semesters of the previous year at the departmental/national level and by type of property.

Evolution of the number of transactions - 47 - Fumel

Yearly data

Descending order
Year
Houses
house
transactions
Houses
house
Price per m²
Apartments
apt.
transactions
Apartments
apt.
Price per m²
2025
24
982 
5
519 
2024
72
1 123 
2
617 
2023
91
957 
8
708 
2022
82
1 066 
4
872 
2021
89
1 000 
8
621 
2020
77
913 
5
555 
2019
87
875 
5
625 
2018
60
832 
6
722 
2017
48
974 
4
276 
2016
61
833 
4
840 
2015
35
1 040 
4
532 
2014
41
750 
6
476 

Analysis

Structure of prices per m²

Values of price percentiles per m² over the periods used for the estimated price of each type of property.

Structure of transaction amounts

Values of transaction amounts percentiles over the periods used for the estimated price of each type of property.

Transaction amounts and prices per m² by percentile

Ascending order
Percentile
Houses
house
Price per m²
Houses
house
Transaction amount
Apartments
apt.
Price per m²
Apartments
apt.
Transaction amount
10th percentile
492 
34 300 
466 
32 500 
20th percentile
611 
48 600 
519 
47 000 
30th percentile
667 
55 090 
548 
50 500 
40th percentile
803 
74 960 
673 
55 000 
50th percentile
982 
100 K
694 
65 000 
60th percentile
1 107 
123 K
708 
75 000 
70th percentile
1 705 
150 K
798 
75 000 
80th percentile
1 915 
183 K
841 
85 000 
90th percentile
2 318 
281 K
860 
136 K

National and departmental comparison

Evolution of the median price per m² of houses

Evolution of the median price per m² of apartments

Quarterly evolution

Evolution of the median price per m²

Evolution of the number of transactions

Quarterly data

Descending order
Quarter
Houses
house
transactions
Houses
house
Price per m²
Apartments
apt.
transactions
Apartments
apt.
Price per m²
2025 Q2
16
1 050 
2
478 
2025 Q1
8
752 
3
825 
2024 Q4
23
1 115 
0
--- 
2024 Q3
23
1 012 
1
673 
2024 Q2
15
1 217 
1
561 
2024 Q1
11
1 402 
0
--- 
2023 Q4
25
978 
1
322 
2023 Q3
20
822 
2
622 
2023 Q2
31
833 
0
--- 
2023 Q1
15
1 373 
5
771 
2022 Q4
20
1 228 
0
--- 
2022 Q3
25
932 
1
841 
2022 Q2
22
1 188 
2
1 021 
2022 Q1
15
843 
1
302 
2021 Q4
20
1 140 
1
1 000 
2021 Q3
22
1 049 
1
667 
2021 Q2
30
1 022 
2
286 
2021 Q1
17
990 
4
628 
2020 Q4
31
1 133 
0
--- 
2020 Q3
21
624 
0
--- 
2020 Q2
11
1 078 
2
422 
2020 Q1
14
744 
3
555 
2019 Q4
21
812 
1
649 
2019 Q3
28
884 
1
234 
2019 Q2
20
1 004 
1
625 
2019 Q1
18
898 
2
717 
2018 Q4
16
1 034 
0
--- 
2018 Q3
14
777 
0
--- 
2018 Q2
18
809 
4
728 
2018 Q1
12
794 
2
722 
2017 Q4
15
1 118 
0
--- 
2017 Q3
10
982 
1
135 
2017 Q2
13
1 000 
1
340 
2017 Q1
10
726 
2
716 
2016 Q4
10
1 004 
0
--- 
2016 Q3
17
850 
1
875 
2016 Q2
19
781 
1
962 
2016 Q1
15
1 018 
2
490 
2015 Q4
5
1 148 
0
--- 
2015 Q3
7
820 
0
--- 
2015 Q2
11
1 057 
2
516 
2015 Q1
12
1 075 
2
698 
2014 Q4
15
806 
1
710 
2014 Q3
12
855 
3
522 
2014 Q2
6
644 
1
430 
2014 Q1
8
746 
1
417 

Overview of the latest real estate transactions

The following list is an anonymized overview of the latest transactions. For more details and to find all transactions, please use the map to view transactions by plot or the transaction search page for a search by criteria.

2025-06-25
50 000 
120  /m²(415 m²)
388  /m²(129 m²)
Sale
Apartments
Apartment
4 rooms
129 m2
Commercial property
143 m2
2 outbuildings
Land
535 m2
-Sols
Commercial property
143 m2
Land
865 m2
-Sols
2025-06-12
55 100 
822  /m²(67 m²)
Sale
Houses
House
3 rooms
67 m2
Land
95 m2
-Sols
2025-06-10
45 000 
511  /m²(88 m²)
Sale
Houses
House
1 room
32 m2
Houses
House
3 rooms
56 m2
1 outbuilding
Land
100 m2
-Sols
2025-05-24
120 000 
628  /m²(191 m²)
Sale
Houses
House
7 rooms
164 m2
Land
662 m2
-Sols
Houses
House
1 room
27 m2
24 outbuildings
Land
1047 m2
-Sols
2025-05-22
600 574 
2 383  /m²(252 m²)
Sale
Houses
House
7 rooms
252 m2
1 outbuilding
Land
2860 m2
-Terrains d'agrément
Land
1740 m2
-Sols
Land
1400 m2
-Prés
1 outbuilding
Land
720 m2
-Pâtures
/Pâture plantée
Land
3050 m2
-Terres
Land
4080 m2
-Pâtures
/Pâture plantée
Land
5655 m2
-Terres
2025-05-22
534 356 
2 754  /m²(194 m²)
Sale
Houses
House
5 rooms
194 m2
2 outbuildings
Land
3426 m2
-Sols
Land
13730 m2
-Terres
Land
11149 m2
-Taillis sous futaie
2025-04-26
208 000 
2 167  /m²(96 m²)
Sale
Houses
House
4 rooms
96 m2
Land
1081 m2
-Sols
2025-04-25
48 000 
436  /m²(110 m²)
Sale
Apartments
Apartment
3 rooms
110 m2
3 outbuildings
Land
123 m2
-Sols
2025-04-24
162 000 
1 884  /m²(86 m²)
Sale
Houses
House
4 rooms
86 m2
Land
2405 m2
-Terrains d'agrément
Land
2405 m2
-Prés
Land
1500 m2
-Sols
2025-04-23
195 000 
1 054  /m²(185 m²)
Sale
Houses
House
7 rooms
185 m2
Land
1173 m2
-Sols
2025-04-18
123 420 
1 046  /m²(118 m²)
Sale
Houses
House
5 rooms
118 m2
Land
204 m2
-Sols
2025-04-15
55 000 
519  /m²(106 m²)
Sale
Apartments
Apartment
4 rooms
106 m2
2025-04-15
51 000 
671  /m²(76 m²)
Sale
Houses
House
3 rooms
76 m2
1 outbuilding
Land
210 m2
-Sols
2025-04-10
149 000 
1 120  /m²(133 m²)
Sale
Houses
House
6 rooms
133 m2
1 outbuilding
Land
964 m2
-Sols
2025-04-09
83 000 
798  /m²(104 m²)
Sale
Houses
House
4 rooms
104 m2
1 outbuilding
Land
1000 m2
-Sols
Land
382 m2
-Terrains d'agrément
Land
18 m2
-Sols
Land
562 m2
-Sols
Land
13 m2
-Jardins
/Jardin potager
Land
136 m2
-Terrains d'agrément
2025-04-08
60 100 
626  /m²(96 m²)
Sale
Houses
House
4 rooms
96 m2
1 outbuilding
Land
284 m2
-Sols
2025-04-01
35 000 
686  /m²(51 m²)
Sale
Houses
House
2 rooms
51 m2
1 outbuilding
Land
140 m2
-Sols
Land
10 m2
-Sols
Land
167 m2
-Sols
2025-04-01
149 055 
1 961  /m²(76 m²)
Sale
Houses
House
3 rooms
76 m2
Land
413 m2
-Sols
Land
40 m2
-Terrains d'agrément
Land
440 m2
-Terrains d'agrément
2025-04-01
87 900 
1 870  /m²(47 m²)
Sale
Houses
House
2 rooms
47 m2
1 outbuilding
Land
439 m2
-Sols
2025-03-28
55 000 
917  /m²(60 m²)
Sale
Houses
House
3 rooms
60 m2
Land
312 m2
-Sols
1171 transactions listed in the municipality

Lot-et-Garonne (47)

Most expensive cities

City
name
Descending orderHouses
house
Price per m²
2 454 
2 406 
2 282 
2 209 
2 156 
2 108 
2 104 
2 101 
2 074 
City
name
Descending orderApartments
apt.
Price per m²
5 176 
3 940 
2 158 
1 949 
1 929 
1 875 

Least expensive cities

City
name
Ascending orderHouses
house
Price per m²
657 
708 
734 
750 
759 
764 
843 
846 
City
name
Ascending orderApartments
apt.
Price per m²
114 
155 
168 
316