emooki
HomePrice mapTransactions
🇬🇧 English🇫🇷 Français🇩🇪 Deutsch🇪🇸 Español🇮🇹 Italiano

Real estate price map


Real estate price map in the municipality of Vergongheon, choose a section to see transactions by parcel.

Haute-Loire (43)

Vergongheon - Real estate price m²

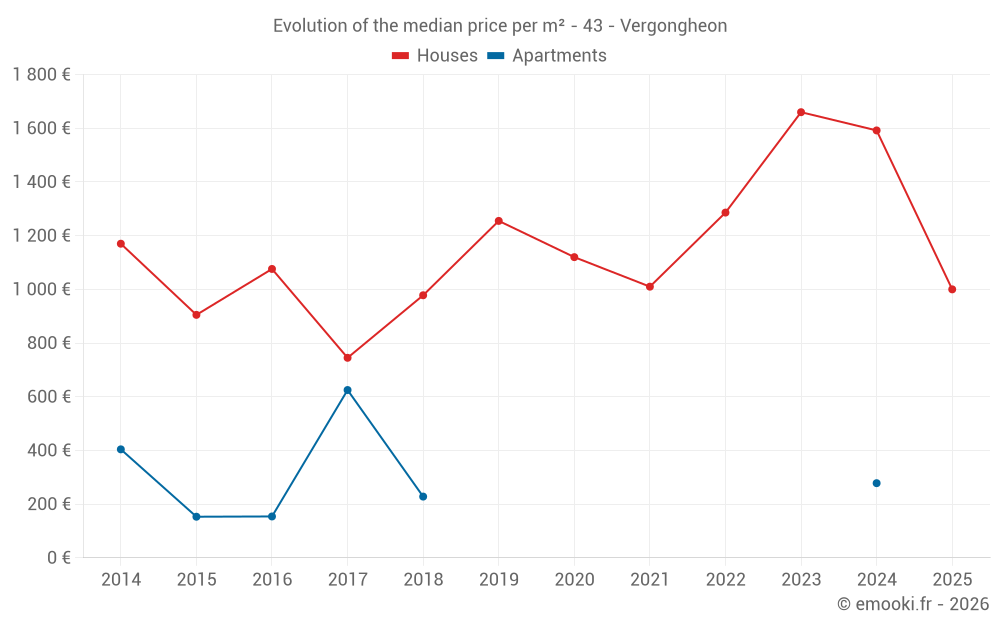
Median price of real estate
in the municipality of Vergongheon

HousesHouses
1 346  /m²
1-23-45-67-89-10
Reliability 8/10
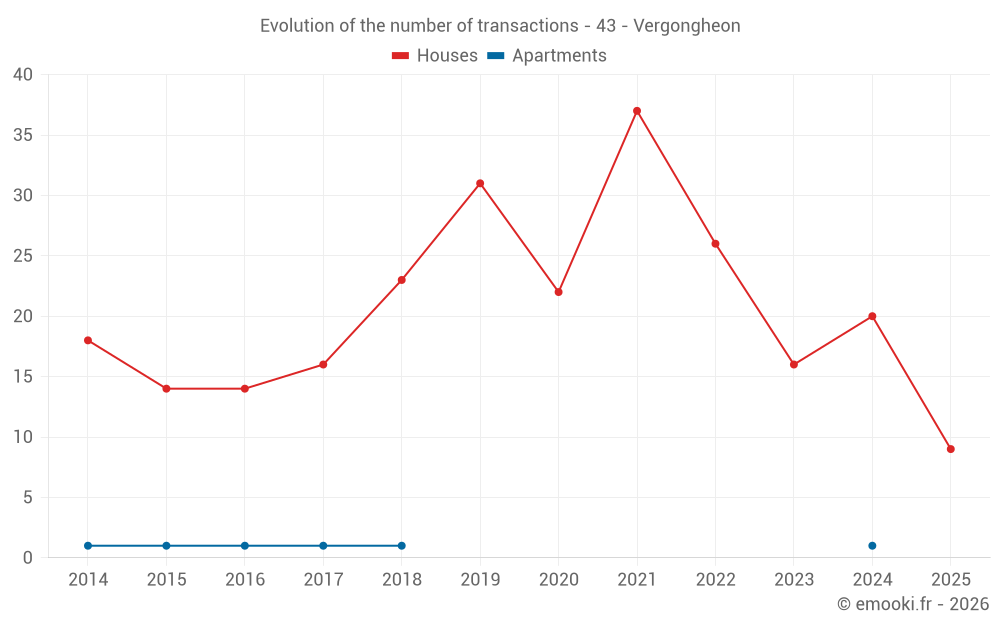
Median price on the 18 transactions of the last 12 months.
from 400 to
1 901  /m²
60% of transactions from the 2nd to the 8th deciles.
ApartmentsApartments
253  /m²
1-23-45-67-89-10
Reliability 1/10
Median price on the 4 transactions of the last 120 months.
DwellingsDwellings
1 338  /m²
1-23-45-67-89-10
Reliability 8/10
Median price on the 19 transactions of the last 12 months.
from 331 to
1 895  /m²
60% of transactions from the 2nd to the 8th deciles.
HousesEvolution of the price per m² of houses since...
1 year
-37%
2 years
-40%
3 years
-22%
4 years
-1%
5 years
-11%
6 years
-20%
7 years
+2.2%
8 years
+34%
9 years
-7.1%
10 years
+10%
11 years
-15%
The price per m² of houses has decreased by 40% since 2 years, but it has increased by 34% in 8 years.

Yearly evolution

Evolution of the median price per m²

Evolution of the median price per m² - 43 - Vergongheon

Evolution of the number of transactions

Warning, last year incomplete. Projections made based on the proportions between semesters of the previous year at the departmental/national level and by type of property.

Evolution of the number of transactions - 43 - Vergongheon

Yearly data

Descending order
Year
Houses
house
transactions
Houses
house
Price per m²
Apartments
apt.
transactions
Apartments
apt.
Price per m²
2025
9
1 000 
0
--- 
2024
20
1 592 
1
278 
2023
16
1 660 
0
--- 
2022
26
1 286 
0
--- 
2021
37
1 010 
0
--- 
2020
22
1 120 
0
--- 
2019
31
1 255 
0
--- 
2018
23
978 
1
228 
2017
16
745 
1
625 
2016
14
1 076 
1
154 
2015
14
905 
1
153 
2014
18
1 170 
1
404 

Analysis

Structure of prices per m²

Values of price percentiles per m² over the periods used for the estimated price of each type of property.

Structure of transaction amounts

Values of transaction amounts percentiles over the periods used for the estimated price of each type of property.

Transaction amounts and prices per m² by percentile

Ascending order
Percentile
Houses
house
Price per m²
Houses
house
Transaction amount
Apartments
apt.
Price per m²
Apartments
apt.
Transaction amount
10th percentile
310 
19 970 
176 
38 100 
20th percentile
400 
23 200 
198 
43 200 
30th percentile
1 000 
90 500 
221 
48 300 
40th percentile
1 134 
103 K
238 
55 000 
50th percentile
1 346 
120 K
253 
62 500 
60th percentile
1 603 
132 K
268 
70 000 
70th percentile
1 836 
174 K
313 
80 000 
80th percentile
1 901 
197 K
417 
95 000 
90th percentile
1 994 
225 K
521 
110 K

National and departmental comparison

Evolution of the median price per m² of houses

Evolution of the median price per m² of apartments

Quarterly evolution

Evolution of the median price per m²

Evolution of the number of transactions

Quarterly data

Descending order
Quarter
Houses
house
transactions
Houses
house
Price per m²
Apartments
apt.
transactions
Apartments
apt.
Price per m²
2025 Q2
3
2 068 
0
--- 
2025 Q1
6
666 
0
--- 
2024 Q4
5
1 568 
1
278 
2024 Q3
4
1 372 
0
--- 
2024 Q2
5
1 833 
0
--- 
2024 Q1
6
1 264 
0
--- 
2023 Q4
4
2 139 
0
--- 
2023 Q3
6
1 074 
0
--- 
2023 Q2
5
1 553 
0
--- 
2023 Q1
1
450 
0
--- 
2022 Q4
5
1 517 
0
--- 
2022 Q3
5
1 343 
0
--- 
2022 Q2
7
881 
0
--- 
2022 Q1
9
940 
0
--- 
2021 Q4
9
889 
0
--- 
2021 Q3
10
1 582 
0
--- 
2021 Q2
8
1 166 
0
--- 
2021 Q1
10
930 
0
--- 
2020 Q4
11
1 244 
0
--- 
2020 Q3
3
138 
0
--- 
2020 Q2
6
1 120 
0
--- 
2020 Q1
2
1 148 
0
--- 
2019 Q4
9
1 342 
0
--- 
2019 Q3
5
1 000 
0
--- 
2019 Q2
9
836 
0
--- 
2019 Q1
8
1 368 
0
--- 
2018 Q4
7
1 348 
0
--- 
2018 Q3
10
909 
1
228 
2018 Q2
1
1 000 
0
--- 
2018 Q1
5
978 
0
--- 
2017 Q4
5
802 
0
--- 
2017 Q3
1
250 
1
625 
2017 Q2
4
856 
0
--- 
2017 Q1
6
861 
0
--- 
2016 Q4
6
992 
0
--- 
2016 Q3
5
1 471 
0
--- 
2016 Q2
2
1 060 
1
154 
2016 Q1
1
1 346 
0
--- 
2015 Q4
3
1 174 
0
--- 
2015 Q3
4
1 196 
0
--- 
2015 Q2
3
471 
0
--- 
2015 Q1
4
902 
1
153 
2014 Q4
1
1 240 
0
--- 
2014 Q3
8
954 
0
--- 
2014 Q2
3
1 263 
0
--- 
2014 Q1
6
1 010 
1
404 

Overview of the latest real estate transactions

The following list is an anonymized overview of the latest transactions. For more details and to find all transactions, please use the map to view transactions by plot or the transaction search page for a search by criteria.

2025-05-23
36 455 
Sale
1 outbuilding
Land
292 m2
-Terres
Land
12718 m2
-Prés
Land
2706 m2
-Terres
Land
6440 m2
-Terres
Land
750 m2
-Prés
Land
1056 m2
-Prés
Land
3178 m2
-Prés
Land
1252 m2
-Prés
Land
193 m2
-Prés
Land
354 m2
-Prés
Land
2030 m2
-Prés
Land
2436 m2
-Terres
Land
1630 m2
-Terres
Land
437 m2
-Terres
Land
1376 m2
-Prés
Land
2047 m2
-Pâtures
/Pâture plantée
Land
6268 m2
-Terres
Land
41846 m2
-Prés
2025-05-14
6 000 
Sale
Land
8970 m2
-Terres
Land
3360 m2
-Terres
Land
813 m2
-Prés
Land
1838 m2
-Terres
Land
1820 m2
-Terres
2025-05-07
15 000 
217  /m²(69 m²)
455  /m²(33 m²)
Sale
Houses
House
2 rooms
33 m2
Commercial property
36 m2
Land
42 m2
-Sols
2025-05-05
20 000 
500  /m²(40 m²)
Sale
Houses
House
2 rooms
40 m2
1 outbuilding
Land
59 m2
-Sols
Land
345 m2
-Sols
Land
16 m2
-Sols
2025-04-26
206 750 
2 068  /m²(100 m²)
Sale
Houses
House
5 rooms
100 m2
1 outbuilding
Land
500 m2
-Sols
Land
1076 m2
-Terrains d'agrément
2025-04-17
22 355 
Sale
Land
225 m2
-Sols
Land
47382 m2
-Pâtures
/Pâture plantée
Land
787 m2
-Terres
Land
41683 m2
-Bois
2025-04-15
35 000 
Sale
Land
1103 m2
-Terrains à bâtir
Land
381 m2
-Terrains à bâtir
2025-04-15
182 050 
2 069  /m²(88 m²)
Sale
Houses
House
3 rooms
88 m2
Land
1199 m2
-Jardins
Land
800 m2
-Sols
Land
82 m2
-Sols
Land
1420 m2
-Terres
2025-04-08
63 069 
Sale
Land
2059 m2
-Terrains à bâtir
2025-04-02
45 000 
283  /m²(159 m²)
425  /m²(106 m²)
Sale
Houses
House
7 rooms
106 m2
Commercial property
43 m2
Commercial property
10 m2
Land
16 m2
-Jardins
2025-03-21
28 000 
329  /m²(85 m²)
Sale
Houses
House
3 rooms
85 m2
Land
60 m2
-Sols
2025-03-18
30 000 
Sale
Land
625 m2
-Sols
Land
277 m2
-Sols
Land
423 m2
-Sols
2025-03-17
6 000 
Sale
Land
2863 m2
-Prés
2025-03-12
130 000 
1 884  /m²(69 m²)
Sale
Houses
House
4 rooms
69 m2
Land
555 m2
-Sols
Land
490 m2
-Terres
2025-03-12
5 000 
56  /m²(90 m²)
Sale
Houses
House
4 rooms
90 m2
1 outbuilding
Land
919 m2
-Sols
2025-02-24
20 000 
333  /m²(60 m²)
Sale
Houses
House
2 rooms
60 m2
Land
59 m2
-Sols
Land
231 m2
-Jardins
Land
64 m2
-Sols
Land
384 m2
-Sols
2025-02-11
110 000 
1 000  /m²(110 m²)
Sale
Houses
House
5 rooms
110 m2
Land
1078 m2
-Jardins
Land
500 m2
-Sols
Land
9 m2
-Sols
2025-02-04
33 
Sale
Land
33 m2
-Sols
2025-01-27
29 900 
369  /m²(81 m²)
Sale
Houses
House
3 rooms
81 m2
Land
81 m2
-Sols
Land
30 m2
-Sols
2025-01-24
600 
Sale
Land
1460 m2
-Terres
515 transactions listed in the municipality

Haute-Loire (43)

Most expensive cities

City
name
Descending orderHouses
house
Price per m²
2 295 
2 272 
2 196 
2 166 
2 146 
City
name
Descending orderApartments
apt.
Price per m²
5 000 
1 946 
1 908 
1 650 
1 600 

Least expensive cities

City
name
Ascending orderHouses
house
Price per m²
213 
326 
429 
429 
451 
470 
500 
City
name
Ascending orderApartments
apt.
Price per m²
22 
71 
100 
130 
214