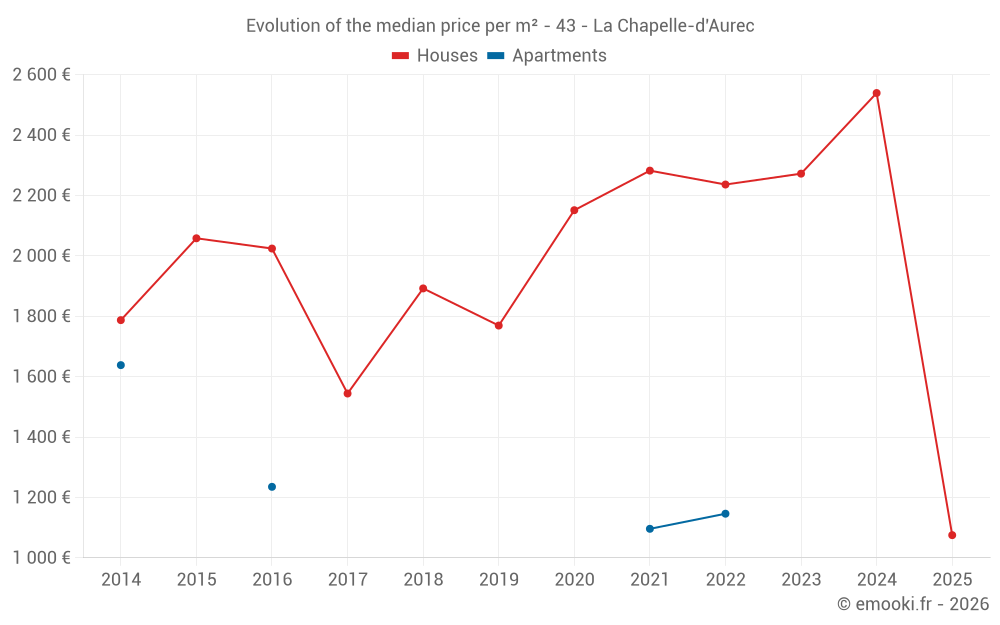
Median price of real estate
in the municipality of La Chapelle-d'Aurec
Houses
2 272 € /m²
Reliability 6/10
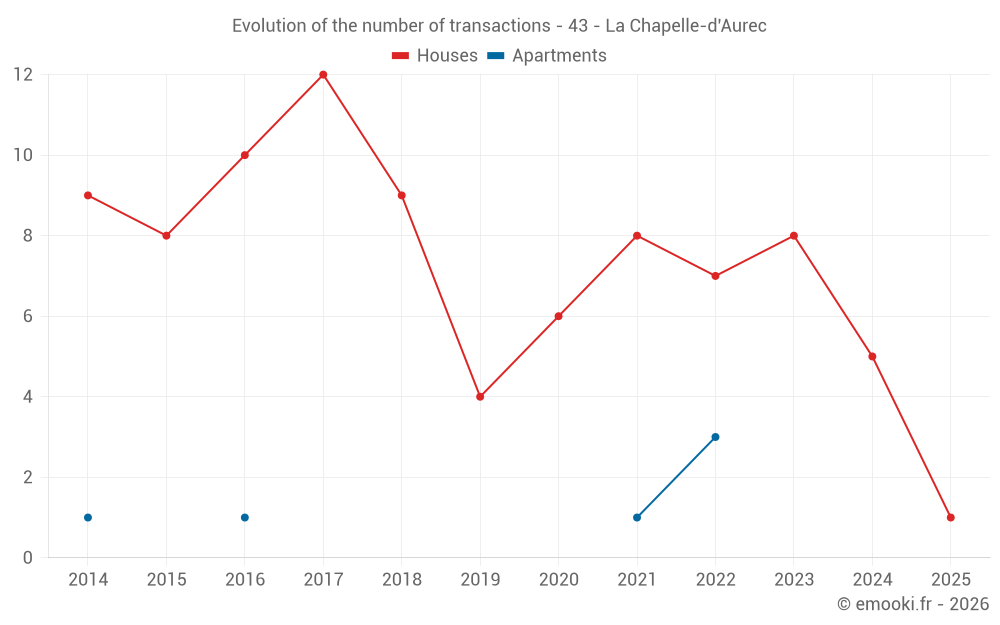
Median price on the 16 transactions of the last 36 months.
from 1 341 to
2 539 € /m²
2 539 € /m²
60% of transactions from the 2nd to the 8th deciles.
Apartments
1 121 € /m²
Reliability 2/10
Median price on the 4 transactions of the last 96 months.
Dwellings
2 272 € /m²
Reliability 6/10
Median price on the 16 transactions of the last 36 months.
from 1 341 to
2 539 € /m²
2 539 € /m²
60% of transactions from the 2nd to the 8th deciles.