emooki
HomePrice mapTransactions
🇬🇧 English🇫🇷 Français🇩🇪 Deutsch🇪🇸 Español🇮🇹 Italiano

Real estate price map


Real estate price map in the municipality of Saint-Ferréol-d'Auroure.

Haute-Loire (43)
Saint-Ferréol-d'Auroure

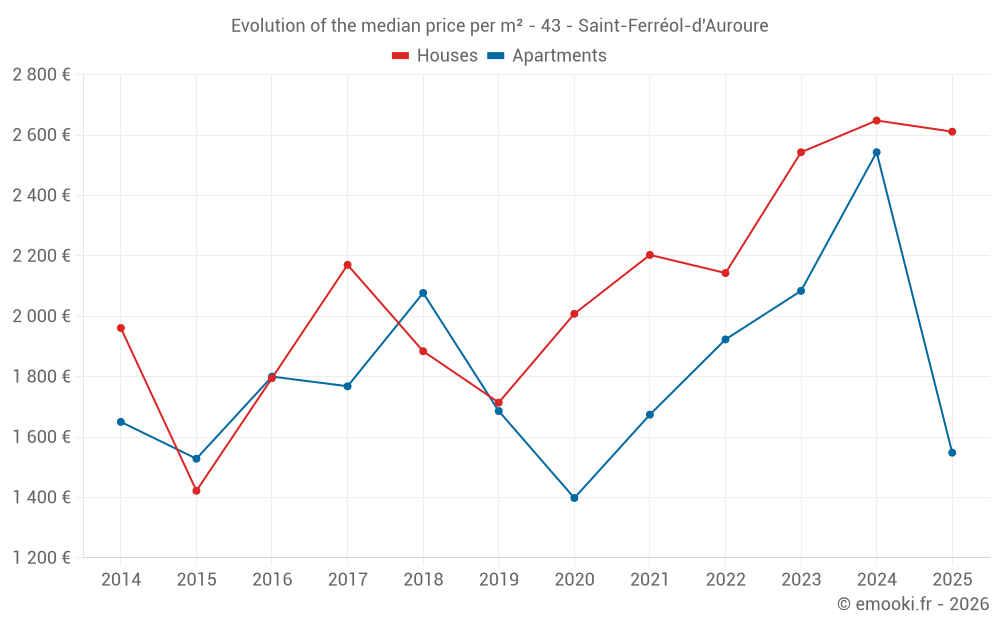
Median price of real estate
in the municipality of Saint-Ferréol-d'Auroure

HousesHouses
2 626  /m²
1-23-45-67-89-10
Reliability 8/10
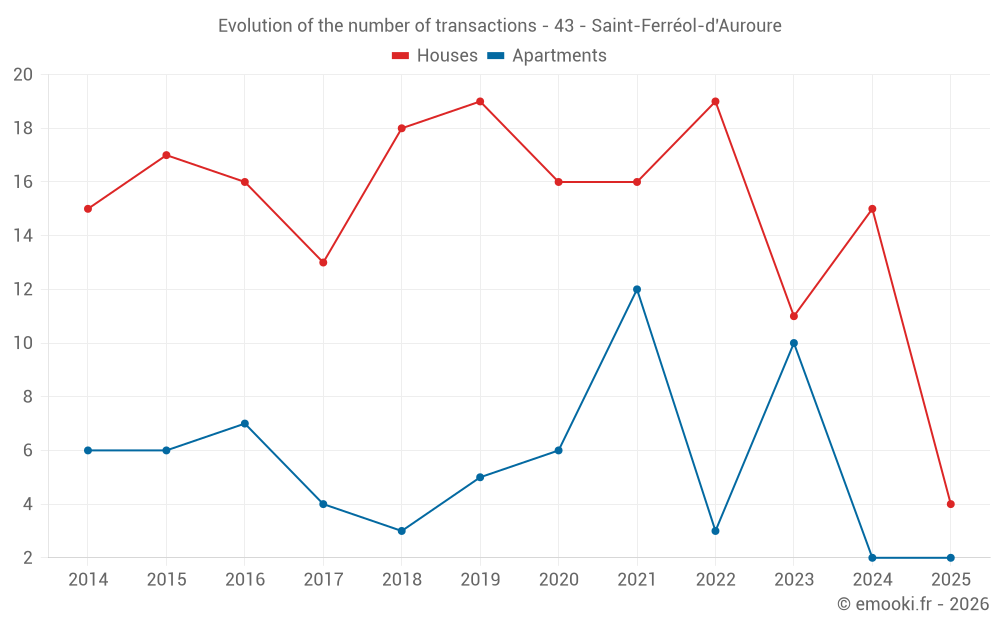
Median price on the 16 transactions of the last 12 months.
from 1 540 to
2 916  /m²
60% of transactions from the 2nd to the 8th deciles.
ApartmentsApartments
2 117  /m²
1-23-45-67-89-10
Reliability 6/10
Median price on the 16 transactions of the last 36 months.
from 1 765 to
2 341  /m²
60% of transactions from the 2nd to the 8th deciles.
DwellingsDwellings
2 454  /m²
1-23-45-67-89-10
Reliability 8/10
Median price on the 18 transactions of the last 12 months.
from 1 419 to
2 900  /m²
60% of transactions from the 2nd to the 8th deciles.
HousesEvolution of the price per m² of houses since...
1 year
--
2 years
--
3 years
--
4 years
--
5 years
--
6 years
--
7 years
--
8 years
--
9 years
--
10 years
--
11 years
--
ApartmentsEvolution of the price per m² of apartments since...
1 year
--
2 years
--
3 years
--
4 years
--
5 years
--
6 years
--
7 years
--
8 years
--
9 years
--
10 years
--
11 years
--

Yearly evolution

Evolution of the median price per m²

Evolution of the number of transactions

Warning, last year incomplete. Projections made based on the proportions between semesters of the previous year at the departmental/national level and by type of property.

Yearly data

Descending order
Year
Houses
house
transactions
Houses
house
Price per m²
Apartments
apt.
transactions
Apartments
apt.
Price per m²
2025
4
2 611 
2
1 548 
2024
15
2 648 
2
2 543 
2023
11
2 543 
10
2 084 
2022
19
2 143 
3
1 923 
2021
16
2 203 
12
1 674 
2020
16
2 008 
6
1 398 
2019
19
1 714 
5
1 686 
2018
18
1 884 
3
2 077 
2017
13
2 170 
4
1 768 
2016
16
1 795 
7
1 800 
2015
17
1 422 
6
1 528 
2014
15
1 961 
6
1 650 

Analysis

Structure of prices per m²

Values of price percentiles per m² over the periods used for the estimated price of each type of property.

Structure of transaction amounts

Values of transaction amounts percentiles over the periods used for the estimated price of each type of property.

Transaction amounts and prices per m² by percentile

Ascending order
Percentile
Houses
house
Price per m²
Houses
house
Transaction amount
Apartments
apt.
Price per m²
Apartments
apt.
Transaction amount
10th percentile
1 162 
148 K
948 
39 000 
20th percentile
1 540 
158 K
1 765 
83 000 
30th percentile
2 348 
214 K
1 837 
91 675 
40th percentile
2 438 
244 K
2 071 
103 K
50th percentile
2 626 
253 K
2 117 
120 K
60th percentile
2 805 
274 K
2 191 
145 K
70th percentile
2 870 
295 K
2 218 
152 K
80th percentile
2 916 
334 K
2 341 
156 K
90th percentile
3 372 
365 K
2 494 
160 K

National and departmental comparison

Evolution of the median price per m² of houses

Evolution of the median price per m² of apartments

Quarterly evolution

Evolution of the median price per m²

Evolution of the number of transactions

Quarterly data

Descending order
Quarter
Houses
house
transactions
Houses
house
Price per m²
Apartments
apt.
transactions
Apartments
apt.
Price per m²
2025 Q2
2
2 567 
1
889 
2025 Q1
2
2 611 
1
2 206 
2024 Q4
6
2 637 
0
--- 
2024 Q3
6
2 617 
0
--- 
2024 Q2
1
3 125 
0
--- 
2024 Q1
2
1 546 
2
2 543 
2023 Q4
3
2 845 
2
2 131 
2023 Q3
3
2 436 
3
1 006 
2023 Q2
3
2 302 
3
2 096 
2023 Q1
2
2 548 
2
2 184 
2022 Q4
7
2 582 
1
2 540 
2022 Q3
5
1 305 
1
1 765 
2022 Q2
4
1 958 
1
1 923 
2022 Q1
3
2 708 
0
--- 
2021 Q4
3
2 493 
1
2 000 
2021 Q3
3
1 930 
3
1 944 
2021 Q2
8
2 203 
5
1 528 
2021 Q1
2
2 064 
3
1 254 
2020 Q4
3
1 724 
3
2 037 
2020 Q3
4
2 150 
0
--- 
2020 Q2
6
1 918 
0
--- 
2020 Q1
3
2 470 
3
1 219 
2019 Q4
5
1 640 
1
1 686 
2019 Q3
3
1 297 
1
2 014 
2019 Q2
5
1 538 
1
2 133 
2019 Q1
6
1 870 
2
1 603 
2018 Q4
6
1 957 
0
--- 
2018 Q3
6
2 225 
1
1 704 
2018 Q2
2
1 618 
1
2 077 
2018 Q1
4
1 463 
1
2 098 
2017 Q4
6
2 094 
2
1 650 
2017 Q3
3
2 290 
1
2 288 
2017 Q2
1
2 893 
1
1 821 
2017 Q1
3
2 074 
0
--- 
2016 Q4
3
1 872 
1
1 354 
2016 Q3
3
1 749 
2
1 432 
2016 Q2
5
1 579 
4
1 804 
2016 Q1
5
1 755 
0
--- 
2015 Q4
3
1 422 
0
--- 
2015 Q3
7
700 
0
--- 
2015 Q2
5
1 802 
4
1 379 
2015 Q1
2
1 647 
2
1 558 
2014 Q4
2
2 140 
2
1 650 
2014 Q3
2
4 734 
2
1 458 
2014 Q2
5
1 961 
1
2 247 
2014 Q1
6
1 836 
1
2 297 

Haute-Loire (43)

Most expensive cities

City
name
Descending orderHouses
house
Price per m²
2 295 
2 272 
2 196 
2 166 
2 146 
City
name
Descending orderApartments
apt.
Price per m²
5 000 
1 946 
1 908 
1 650 
1 600 

Least expensive cities

City
name
Ascending orderHouses
house
Price per m²
213 
326 
429 
429 
451 
470 
500 
City
name
Ascending orderApartments
apt.
Price per m²
22 
71 
100 
130 
214