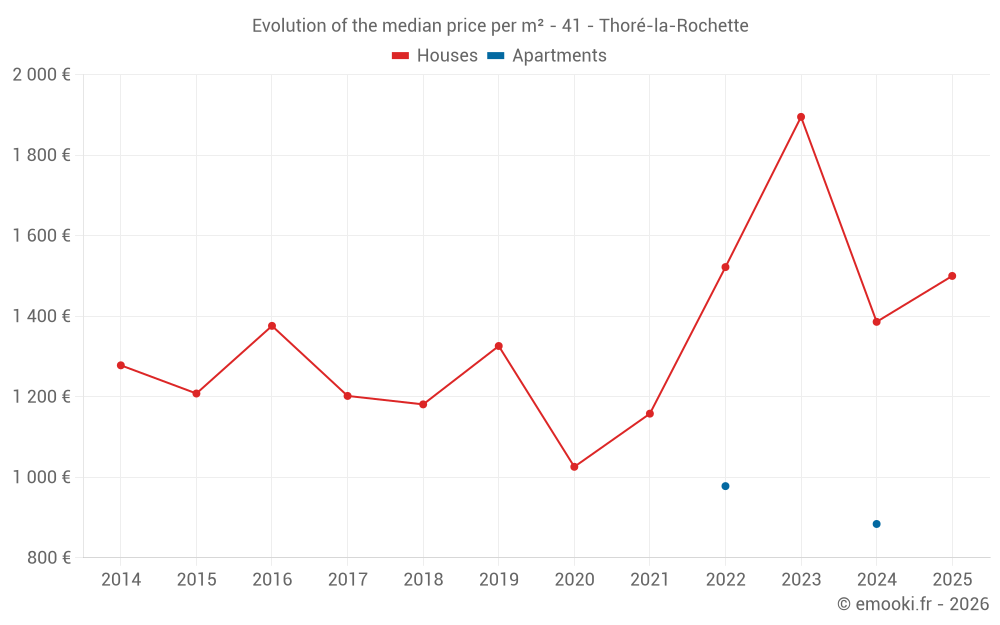
Median price of real estate
in the municipality of Thoré-la-Rochette
Houses
1 490 € /m²
Reliability 8/10
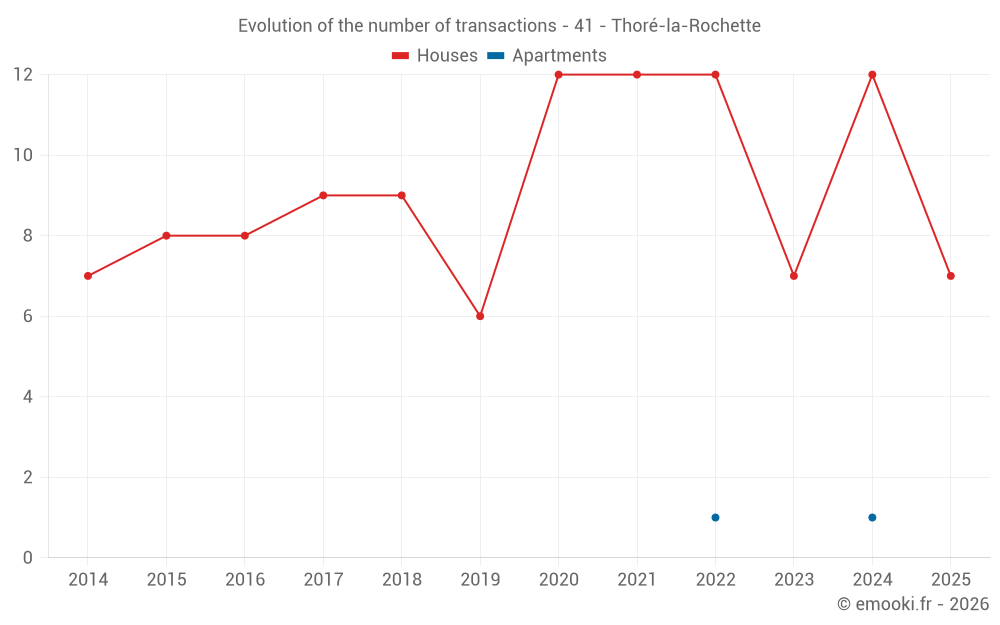
Median price on the 16 transactions of the last 12 months.
from 1 327 to
1 667 € /m²
1 667 € /m²
60% of transactions from the 2nd to the 8th deciles.
Apartments
931 € /m²
Reliability 1/10
Median price on the 2 transactions of the last 120 months.
Dwellings
1 490 € /m²
Reliability 8/10
Median price on the 16 transactions of the last 12 months.
from 1 327 to
1 667 € /m²
1 667 € /m²
60% of transactions from the 2nd to the 8th deciles.