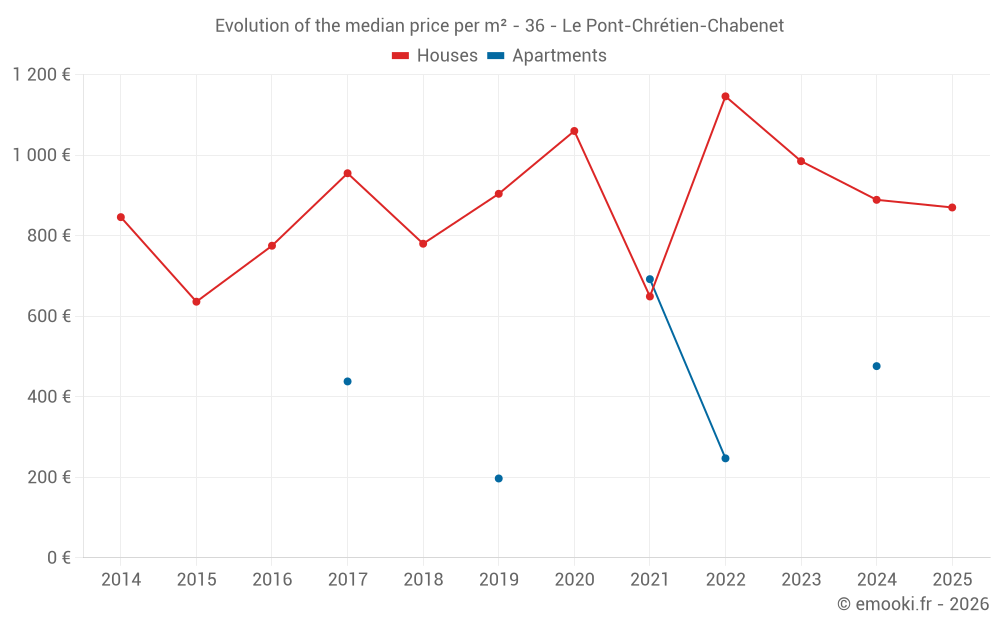
Median price of real estate
in the municipality of Le Pont-Chrétien-Chabenet
Houses
889 € /m²
Reliability 8/10
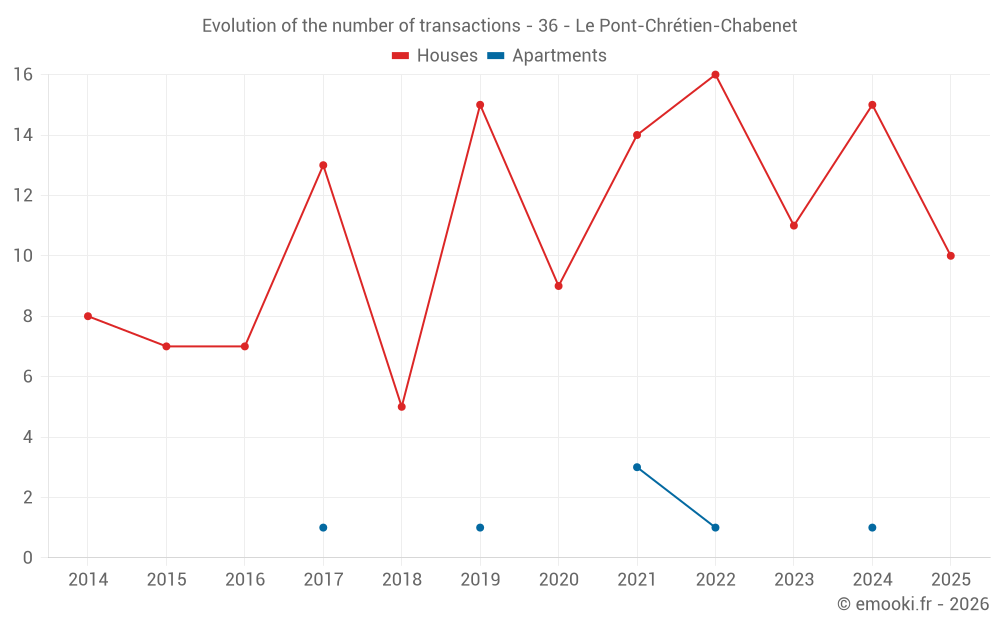
Median price on the 19 transactions of the last 12 months.
from 542 to
1 540 € /m²
1 540 € /m²
60% of transactions from the 2nd to the 8th deciles.
Apartments
438 € /m²
Reliability 2/10
Median price on the 7 transactions of the last 96 months.
Dwellings
889 € /m²
Reliability 8/10
Median price on the 19 transactions of the last 12 months.
from 542 to
1 540 € /m²
1 540 € /m²
60% of transactions from the 2nd to the 8th deciles.