emooki
HomePrice mapTransactions
🇬🇧 English🇫🇷 Français🇩🇪 Deutsch🇪🇸 Español🇮🇹 Italiano

Real estate price map


Real estate price map in the municipality of Neuillay-les-Bois, choose a section to see transactions by parcel.

Indre (36)
Neuillay-les-Bois

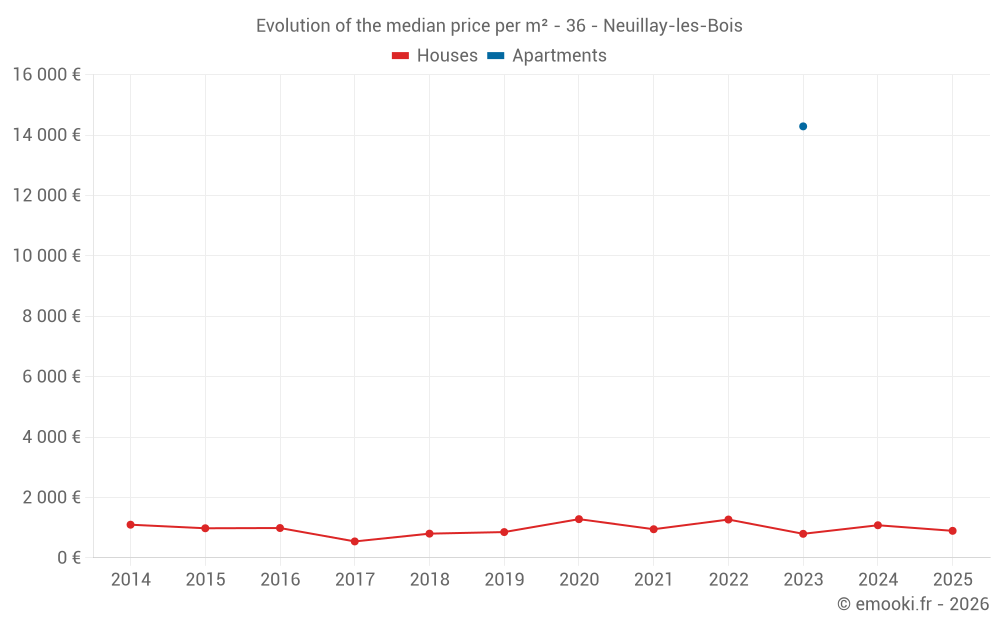
Median price of real estate
in the municipality of Neuillay-les-Bois

HousesHouses
1 111 € /m²
1-23-45-67-89-10
Reliability 7/10
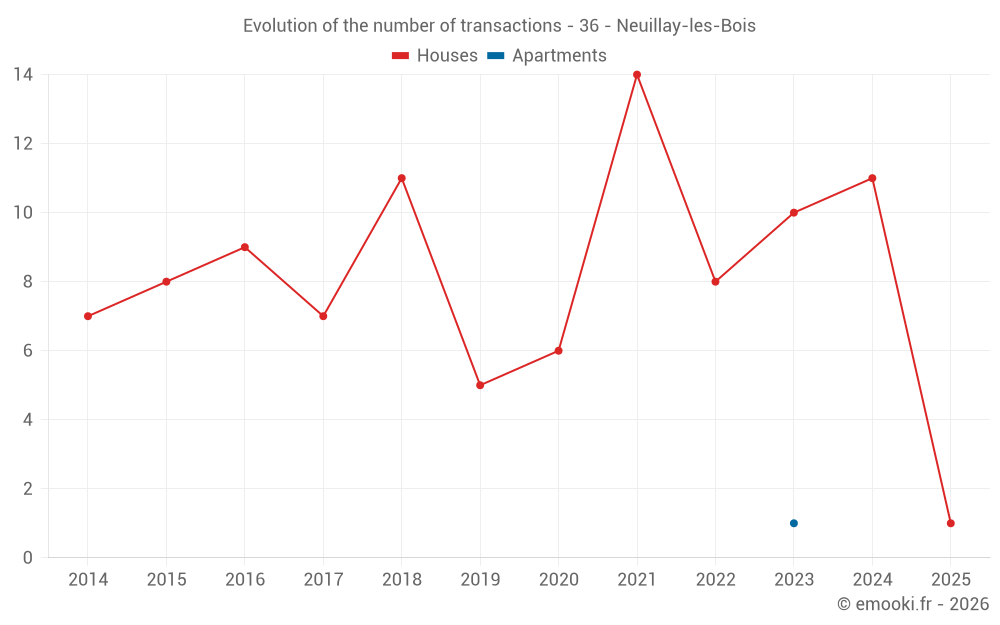
Median price on the 15 transactions of the last 24 months.
from 824 to
1 319 € /m²
60% of transactions from the 2nd to the 8th deciles.
ApartmentsApartments
14 286 € /m²
1-23-45-67-89-10
Reliability 1/10
Price of the unique transaction of the last 120 months.
DwellingsDwellings
1 166 € /m²
1-23-45-67-89-10
Reliability 7/10
Median price on the 16 transactions of the last 24 months.
from 865 to
1 343 € /m²
60% of transactions from the 2nd to the 8th deciles.

Yearly evolution

Evolution of the median price per m²

Evolution of the number of transactions

Warning, last year incomplete. Projections made based on the proportions between semesters of the previous year at the departmental/national level and by type of property.

Yearly data

Descending order
Year
Houses
house
transactions
Houses
house
Price per m²
Apartments
apt.
transactions
Apartments
apt.
Price per m²
2025
1
893 €
0
--- €
2024
11
1 078 €
0
--- €
2023
10
794 €
1
14 286 €
2022
8
1 267 €
0
--- €
2021
14
946 €
0
--- €
2020
6
1 280 €
0
--- €
2019
5
852 €
0
--- €
2018
11
800 €
0
--- €
2017
7
542 €
0
--- €
2016
9
986 €
0
--- €
2015
8
978 €
0
--- €
2014
7
1 096 €
0
--- €

Analysis

Structure of prices per m²

Values of price percentiles per m² over the periods used for the estimated price of each type of property.

Structure of transaction amounts

Values of transaction amounts percentiles over the periods used for the estimated price of each type of property.

Transaction amounts and prices per m² by percentile

Ascending order
Percentile
Houses
house
Price per m²
Houses
house
Transaction amount
Apartments
apt.
Price per m²
Apartments
apt.
Transaction amount
10th percentile
604 €
48 800 €
14 286 €
3 000 K€
20th percentile
824 €
54 000 €
14 286 €
3 000 K€
30th percentile
911 €
55 700 €
14 286 €
3 000 K€
40th percentile
1 040 €
68 400 €
14 286 €
3 000 K€
50th percentile
1 111 €
83 000 €
14 286 €
3 000 K€
60th percentile
1 238 €
87 200 €
14 286 €
3 000 K€
70th percentile
1 293 €
102 K€
14 286 €
3 000 K€
80th percentile
1 319 €
112 K€
14 286 €
3 000 K€
90th percentile
1 420 €
136 K€
14 286 €
3 000 K€

National and departmental comparison

Evolution of the median price per m² of houses

Evolution of the median price per m² of apartments

Quarterly evolution

Evolution of the median price per m²

Evolution of the number of transactions

Quarterly data

Descending order
Quarter
Houses
house
transactions
Houses
house
Price per m²
Apartments
apt.
transactions
Apartments
apt.
Price per m²
2025 Q1
1
893 €
0
--- €
2024 Q4
3
1 078 €
0
--- €
2024 Q3
4
1 288 €
0
--- €
2024 Q2
2
715 €
0
--- €
2024 Q1
2
689 €
0
--- €
2023 Q4
1
1 220 €
0
--- €
2023 Q3
2
1 386 €
1
14 286 €
2023 Q2
1
833 €
0
--- €
2023 Q1
6
621 €
0
--- €
2022 Q4
3
1 588 €
0
--- €
2022 Q3
1
667 €
0
--- €
2022 Q2
4
1 306 €
0
--- €
2021 Q4
3
862 €
0
--- €
2021 Q3
5
1 524 €
0
--- €
2021 Q2
3
519 €
0
--- €
2021 Q1
3
1 410 €
0
--- €
2020 Q4
2
2 714 €
0
--- €
2020 Q3
2
656 €
0
--- €
2020 Q2
1
1 369 €
0
--- €
2020 Q1
1
2 375 €
0
--- €
2019 Q4
1
536 €
0
--- €
2019 Q3
2
999 €
0
--- €
2019 Q2
1
974 €
0
--- €
2019 Q1
1
852 €
0
--- €
2018 Q4
1
973 €
0
--- €
2018 Q3
3
800 €
0
--- €
2018 Q2
4
826 €
0
--- €
2018 Q1
3
741 €
0
--- €
2017 Q4
2
477 €
0
--- €
2017 Q3
2
576 €
0
--- €
2017 Q2
2
948 €
0
--- €
2017 Q1
1
542 €
0
--- €
2016 Q4
1
333 €
0
--- €
2016 Q3
4
1 120 €
0
--- €
2016 Q2
2
978 €
0
--- €
2016 Q1
2
930 €
0
--- €
2015 Q3
2
1 124 €
0
--- €
2015 Q1
6
978 €
0
--- €
2014 Q4
2
1 690 €
0
--- €
2014 Q3
1
1 017 €
0
--- €
2014 Q2
2
1 032 €
0
--- €
2014 Q1
2
1 008 €
0
--- €

Overview of the latest real estate transactions

The following list is an anonymized overview of the latest transactions. For more details and to find all transactions, please use the map to view transactions by plot or the transaction search page for a search by criteria.

2025-03-29
50 000 €
893 € /m²(56 m²)
Sale
Houses
House
4 rooms
56 m2
2 outbuildings
Land
451 m2
-Sols
1 outbuilding
Land
1502 m2
-Terres
Land
1176 m2
-Sols
Land
510 m2
-Jardins
Land
11 m2
-Sols
Land
7612 m2
-Terres
Land
175 m2
-Terres
Land
43 m2
-Terres
2025-03-11
12 000 €
Sale
Land
5480 m2
-Terres
Land
21090 m2
-Terres
2025-02-08
200 €
Sale
Land
256 m2
-Vignes
2025-01-29
1 500 €
Sale
Land
2282 m2
-Prés
Land
1368 m2
-Prés
Land
211 m2
-Taillis simples
2025-01-18
3 000 €
Sale
Land
5950 m2
-Terres
2024-12-27
15 000 €
Exchange
Land
4536 m2
-Terres
Land
6640 m2
-Terres
Land
2904 m2
-Landes
Land
880 m2
-Terres
Land
3338 m2
-Terres
Land
2664 m2
-Terres
Land
22949 m2
-Terres
2024-12-27
1 982 €
Exchange
Land
2916 m2
-Terres
Land
2746 m2
-Terres
2024-12-11
55 000 €
982 € /m²(56 m²)
Sale
Houses
House
3 rooms
56 m2
Land
250 m2
-Sols
Land
682 m2
-Jardins
2024-11-29
89 000 €
1 745 € /m²(51 m²)
Sale
Houses
House
3 rooms
51 m2
1 outbuilding
Land
240 m2
-Sols
Land
114 m2
-Jardins
Land
164 m2
-Jardins
2024-11-27
55 000 €
1 078 € /m²(51 m²)
Sale
Houses
House
3 rooms
51 m2
Land
447 m2
-Sols
Land
110 m2
-Sols
2024-11-16
3 000 €
Sale
Land
2580 m2
-Taillis sous futaie
Land
832 m2
-Terres
2024-10-25
25 000 €
Sale
Land
2312 m2
-Taillis simples
Land
6396 m2
-Eaux
/ETANG
2024-09-25
27 000 €
Sale
Land
7524 m2
-Eaux
/ETANG
Land
2978 m2
-Eaux
/ETANG
2024-09-06
145 000 €
1 343 € /m²(108 m²)
Sale
Houses
House
4 rooms
108 m2
3 outbuildings
Land
1000 m2
-Sols
Land
1000 m2
-Sols
Land
1123 m2
-Terres
2024-08-13
13 200 €
Sale
Land
34360 m2
-Terres
Land
4402 m2
-Terres
2024-08-08
27 000 €
Sale
1 outbuilding
Land
9965 m2
-Eaux
/ETANG
Land
380 m2
-Sols
1 outbuilding
Land
6535 m2
-Terres
Land
12921 m2
-Eaux
/ETANG
2024-07-26
105 000 €
1 313 € /m²(80 m²)
Sale
Houses
House
4 rooms
80 m2
Land
752 m2
-Sols
2024-07-11
275 600 €
1 837 € /m²(150 m²)
Sale
Houses
House
9 rooms
150 m2
Commercial property
3 outbuildings
Land
956 m2
-Sols
Land
578 m2
-Eaux
/ETANG
Land
1020 m2
-Eaux
/ETANG
Land
2568 m2
-Eaux
/ETANG
Land
3113 m2
-Eaux
/ETANG
Land
4518 m2
-Eaux
/ETANG
Land
1040 m2
-Eaux
/ETANG
Land
2118 m2
-Eaux
/ETANG
Land
964 m2
-Eaux
/ETANG
Land
1336 m2
-Jardins
Land
16277 m2
-Terres
Land
3744 m2
-Eaux
/ETANG
Land
4388 m2
-Eaux
/ETANG
Land
210 m2
-Sols
Land
20346 m2
-Eaux
/ETANG
Land
6940 m2
-Eaux
/ETANG
Land
7436 m2
-Futaies résineuses
/Pins
2024-07-08
110 000 €
1 264 € /m²(87 m²)
Sale
Houses
House
5 rooms
87 m2
1 outbuilding
Land
891 m2
-Sols
2024-07-04
86 000 €
662 € /m²(130 m²)
Sale
Houses
House
6 rooms
130 m2
1 outbuilding
Land
182 m2
-Sols
Land
842 m2
-Jardins
229 transactions listed in the municipality

Indre (36)

Most expensive cities

City
name
Descending orderHouses
house
Price per m²
1 667 €
1 634 €
1 554 €
1 515 €
1 429 €
1 402 €
1 392 €
1 372 €
1 364 €
1 363 €
City
name
Descending orderApartments
apt.
Price per m²
14 286 €
1 748 €
1 731 €
1 452 €
1 264 €
1 244 €
1 241 €
1 097 €
1 062 €
1 029 €

Least expensive cities

City
name
Ascending orderHouses
house
Price per m²
381 €
385 €
395 €
400 €
484 €
530 €
534 €
536 €
543 €
550 €
City
name
Ascending orderApartments
apt.
Price per m²
39 €
154 €
194 €
252 €
278 €
284 €
286 €
289 €