emooki
HomePrice mapTransactions
🇬🇧 English🇫🇷 Français🇩🇪 Deutsch🇪🇸 Español🇮🇹 Italiano

Real estate price map


Real estate price map in the municipality of La Pérouille, choose a section to see transactions by parcel.

Indre (36)
La Pérouille

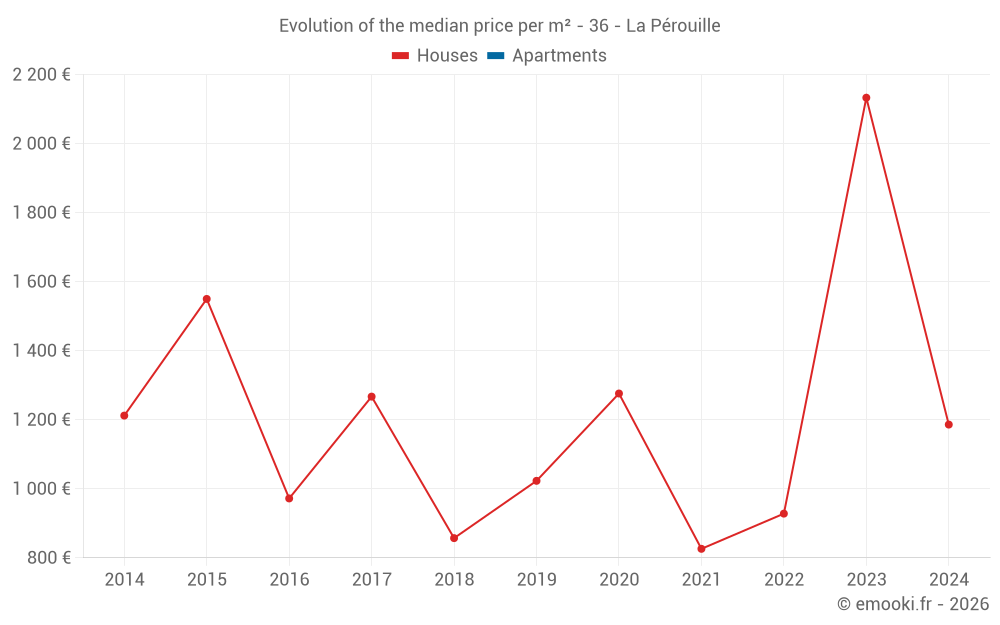
Median price of real estate
in the municipality of La Pérouille

HousesHouses
1 186  /m²
1-23-45-67-89-10
Reliability 5/10
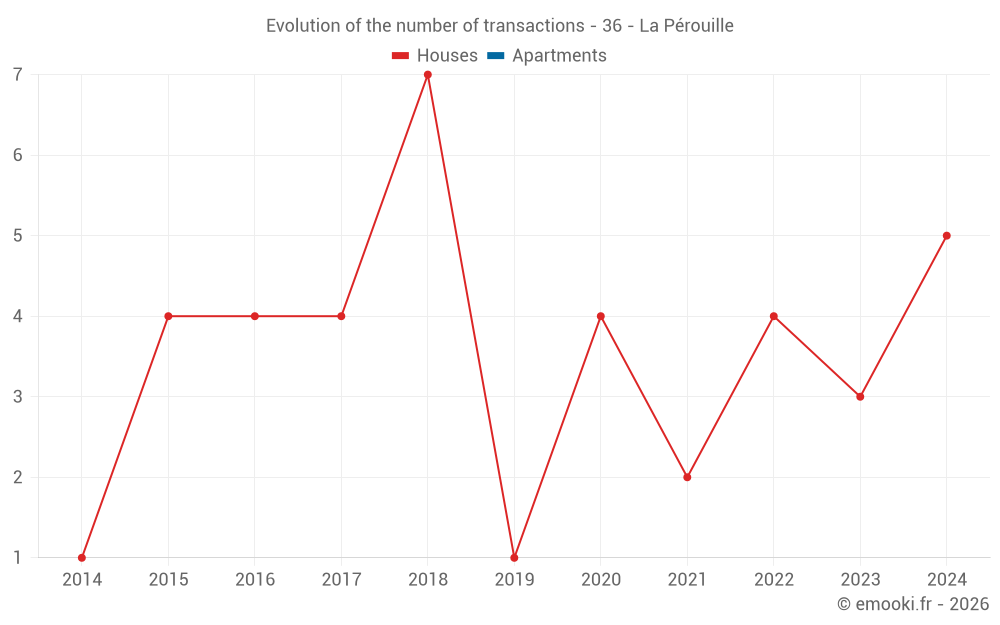
Median price on the 13 transactions of the last 48 months.
from 770 to
1 899  /m²
60% of transactions from the 2nd to the 8th deciles.

Yearly evolution

Evolution of the median price per m²

Evolution of the number of transactions

Warning, last year incomplete.

Yearly data

Descending order
Year
Houses
house
transactions
Houses
house
Price per m²
Apartments
apt.
transactions
Apartments
apt.
Price per m²
2025
0
--- 
0
--- 
2024
5
1 186 
0
--- 
2023
3
2 133 
0
--- 
2022
4
928 
0
--- 
2021
2
826 
0
--- 
2020
4
1 276 
0
--- 
2019
1
1 023 
0
--- 
2018
7
857 
0
--- 
2017
4
1 267 
0
--- 
2016
4
972 
0
--- 
2015
4
1 550 
0
--- 
2014
1
1 212 
0
--- 

Analysis

Structure of prices per m²

Values of price percentiles per m² over the periods used for the estimated price of each type of property.

Structure of transaction amounts

Values of transaction amounts percentiles over the periods used for the estimated price of each type of property.

Transaction amounts and prices per m² by percentile

Ascending order
Percentile
Houses
house
Price per m²
Houses
house
Transaction amount
Apartments
apt.
Price per m²
Apartments
apt.
Transaction amount
10th percentile
710 
51 000 
--- 
--- 
20th percentile
770 
56 000 
--- 
--- 
30th percentile
880 
64 400 
--- 
--- 
40th percentile
938 
106 K
--- 
--- 
50th percentile
1 186 
130 K
--- 
--- 
60th percentile
1 454 
137 K
--- 
--- 
70th percentile
1 546 
159 K
--- 
--- 
80th percentile
1 899 
163 K
--- 
--- 
90th percentile
2 130 
177 K
--- 
--- 

National and departmental comparison

Evolution of the median price per m² of houses

Evolution of the median price per m² of apartments

Quarterly evolution

Evolution of the median price per m²

Evolution of the number of transactions

Quarterly data

Descending order
Quarter
Houses
house
transactions
Houses
house
Price per m²
Apartments
apt.
transactions
Apartments
apt.
Price per m²
2024 Q4
1
705 
0
--- 
2024 Q2
1
1 571 
0
--- 
2024 Q1
3
1 186 
0
--- 
2023 Q4
1
1 529 
0
--- 
2023 Q3
2
2 162 
0
--- 
2022 Q3
2
1 516 
0
--- 
2022 Q2
2
837 
0
--- 
2021 Q3
1
831 
0
--- 
2021 Q2
1
820 
0
--- 
2020 Q4
1
1 188 
0
--- 
2020 Q3
2
1 516 
0
--- 
2020 Q1
1
1 174 
0
--- 
2019 Q2
1
1 023 
0
--- 
2018 Q4
2
1 170 
0
--- 
2018 Q3
3
958 
0
--- 
2018 Q2
1
273 
0
--- 
2018 Q1
1
644 
0
--- 
2017 Q4
1
1 398 
0
--- 
2017 Q2
1
1 433 
0
--- 
2017 Q1
2
1 004 
0
--- 
2016 Q4
1
733 
0
--- 
2016 Q3
1
1 693 
0
--- 
2016 Q1
2
762 
0
--- 
2015 Q4
1
1 435 
0
--- 
2015 Q3
2
1 084 
0
--- 
2015 Q2
1
1 665 
0
--- 
2014 Q1
1
1 212 
0
--- 

Overview of the latest real estate transactions

The following list is an anonymized overview of the latest transactions. For more details and to find all transactions, please use the map to view transactions by plot or the transaction search page for a search by criteria.

2025-04-10
500 
Sale
Land
810 m2
-Vignes
2025-03-11
12 000 
Sale
Land
5480 m2
-Terres
Land
21090 m2
-Terres
2024-11-23
80 189 
246  /m²(326 m²)
501  /m²(160 m²)
Sale
Houses
House
3 rooms
160 m2
Commercial property
166 m2
3 outbuildings
Land
1440 m2
-Sols
2024-11-19
55 000 
705  /m²(78 m²)
Sale
Land
3172 m2
-Terres
Land
365 m2
-Sols
Land
925 m2
-Jardins
Houses
House
3 rooms
78 m2
1 outbuilding
Land
189 m2
-Sols
Land
1029 m2
-Terres
Land
2473 m2
-Terres
Land
36 m2
-Sols
2024-05-23
31 800 
663  /m²(48 m²)
Sale
Houses
House
2 rooms
48 m2
1 outbuilding
Land
194 m2
-Sols
Land
753 m2
-Terres
Land
297 m2
-Sols
Land
5008 m2
-Terres
Land
7675 m2
-Terres
2024-04-27
165 000 
1 571  /m²(105 m²)
Sale
Houses
House
4 rooms
105 m2
Land
1000 m2
-Sols
Land
2540 m2
-Terrains d'agrément
2024-04-02
5 211 
Sale
Land
10859 m2
-Terres
2024-04-02
3 779 
Sale
Land
7872 m2
-Terres
2024-03-23
132 000 
1 435  /m²(92 m²)
Sale
Houses
House
3 rooms
92 m2
1 outbuilding
Land
1263 m2
-Sols
Land
1185 m2
-Taillis sous futaie
2024-03-07
2 384 
Sale
Land
4630 m2
-Taillis sous futaie
2024-02-07
30 000 
Sale
Land
23640 m2
-Terres
Land
49820 m2
-Terres
Land
11040 m2
-Terres
Land
8515 m2
-Terres
2024-01-29
115 000 
1 186  /m²(97 m²)
Sale
Houses
House
3 rooms
97 m2
Land
216 m2
-Sols
Land
1595 m2
-Terres
2024-01-24
50 000 
704  /m²(71 m²)
Sale
Houses
House
3 rooms
71 m2
1 outbuilding
Land
7344 m2
-Taillis sous futaie
Land
2666 m2
-Sols
2024-01-20
16 558 
Sale
Land
6680 m2
-Terres
Land
6310 m2
-Terres
Land
1738 m2
-Terres
Land
20502 m2
-Terres
2024-01-13
13 230 
Sale
Land
17160 m2
-Terres
Land
3840 m2
-Taillis simples
Land
7150 m2
-Terres
2023-12-22
159 000 
1 529  /m²(104 m²)
Sale
Houses
House
6 rooms
104 m2
1 outbuilding
Land
646 m2
-Jardins
Land
1000 m2
-Sols
Land
375 m2
-Terres
2023-10-11
21 039 
Sale
Land
34310 m2
-Terres
Land
33530 m2
-Terres
2023-10-11
1 100 
Sale
Land
1454 m2
-Jardins
2023-09-20
195 000 
2 191  /m²(89 m²)
Sale
Houses
House
4 rooms
89 m2
1 outbuilding
Land
20407 m2
-Terres
Land
3394 m2
-Sols
Land
2980 m2
-Terres
2023-08-12
160 000 
2 133  /m²(75 m²)
Sale
Houses
House
2 rooms
23 m2
Houses
House
2 rooms
52 m2
1 outbuilding
Land
1698 m2
-Jardins
Land
1000 m2
-Sols
Land
1591 m2
-Terres
96 transactions listed in the municipality

Indre (36)

Most expensive cities

City
name
Descending orderHouses
house
Price per m²
1 667 
1 634 
1 554 
1 515 
1 429 
1 392 
1 372 
1 364 
1 363 
City
name
Descending orderApartments
apt.
Price per m²
14 286 
1 748 
1 452 
1 264 
1 244 
1 241 
1 062 
1 029 

Least expensive cities

City
name
Ascending orderHouses
house
Price per m²
381 
385 
395 
400 
530 
543 
550 
City
name
Ascending orderApartments
apt.
Price per m²
39 
194 
278 
284 
286 
289