Median price of real estate
in the municipality of Saint-Méloir-des-Ondes
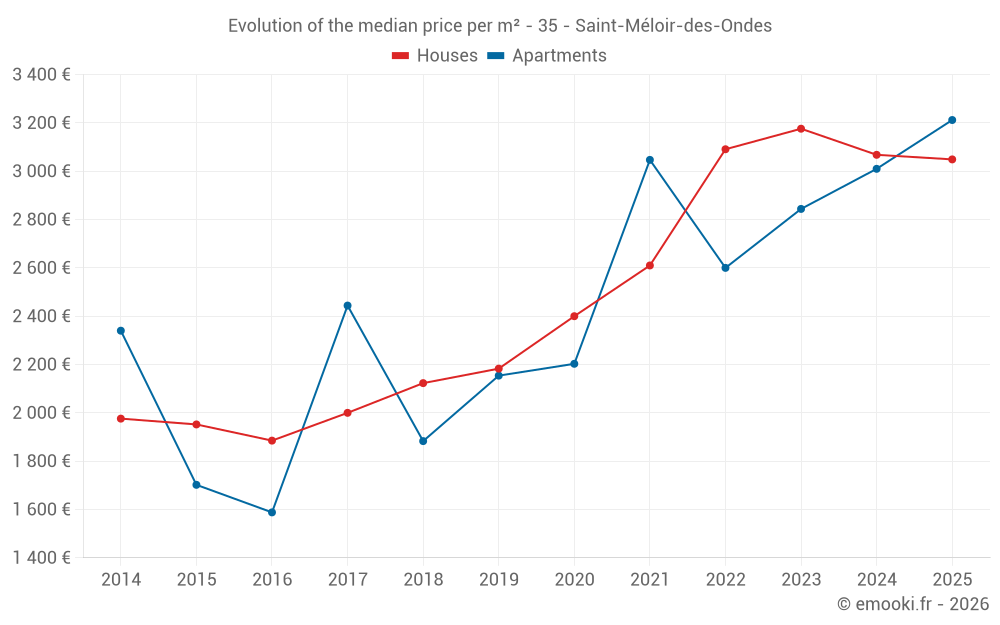
Houses
3 070 € /m²
Reliability 8/10
Median price on the 40 transactions of the last 12 months.
from 2 298 to
3 884 € /m²
3 884 € /m²
60% of transactions from the 2nd to the 8th deciles.
Apartments
3 068 € /m²
Reliability 7/10
Median price on the 18 transactions of the last 24 months.
from 2 608 to
3 578 € /m²
3 578 € /m²
60% of transactions from the 2nd to the 8th deciles.
Dwellings
3 049 € /m²
Reliability 9/10
Median price on the 19 transactions of the last 6 months.
from 2 455 to
3 534 € /m²
3 534 € /m²
60% of transactions from the 2nd to the 8th deciles.