emooki
HomePrice mapTransactions
🇬🇧 English🇫🇷 Français🇩🇪 Deutsch🇪🇸 Español🇮🇹 Italiano

Real estate price map


Real estate price map in the municipality of La Richardais, choose a section to see transactions by parcel.

Ille-et-Vilaine (35)

La Richardais - Real estate price m²

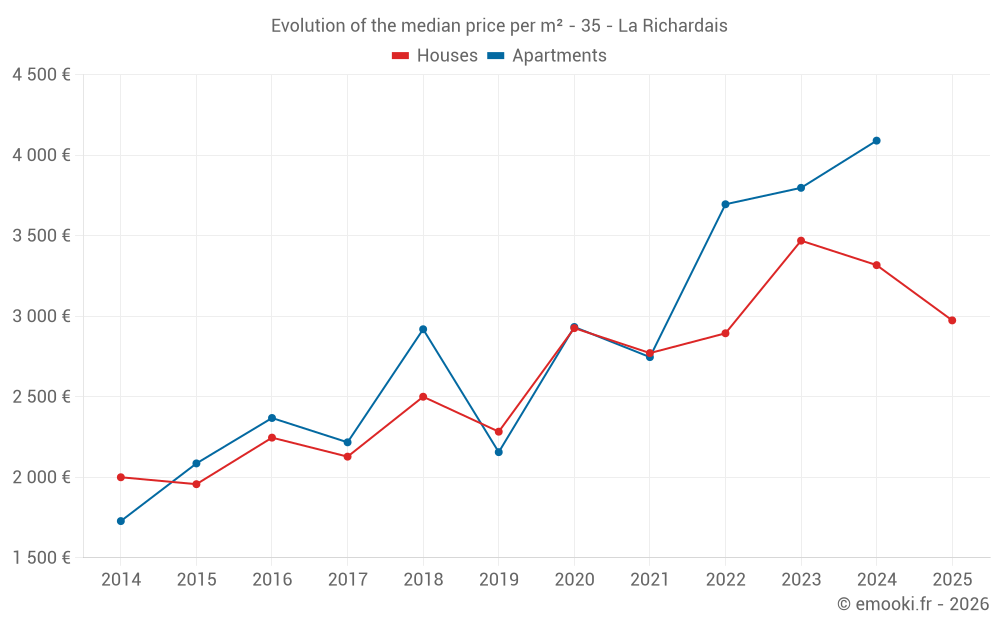
Median price of real estate
in the municipality of La Richardais

HousesHouses
3 857  /m²
1-23-45-67-89-10
Reliability 8/10
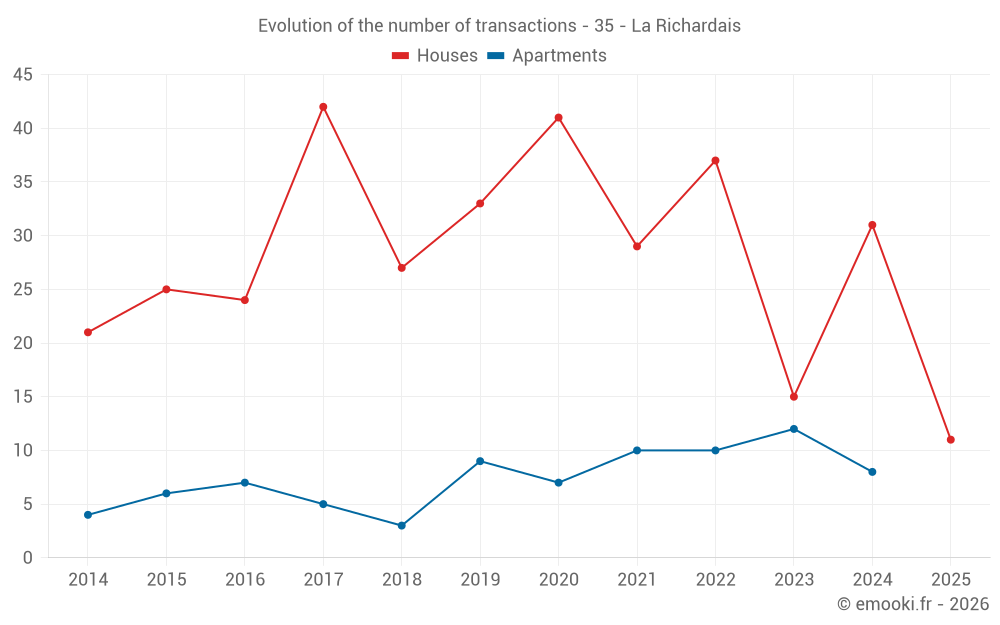
Median price on the 29 transactions of the last 12 months.
from 2 824 to
4 535  /m²
60% of transactions from the 2nd to the 8th deciles.
ApartmentsApartments
4 011  /m²
1-23-45-67-89-10
Reliability 6/10
Median price on the 27 transactions of the last 36 months.
from 3 220 to
4 677  /m²
60% of transactions from the 2nd to the 8th deciles.
DwellingsDwellings
3 857  /m²
1-23-45-67-89-10
Reliability 8/10
Median price on the 33 transactions of the last 12 months.
from 2 782 to
4 556  /m²
60% of transactions from the 2nd to the 8th deciles.
HousesEvolution of the price per m² of houses since...
1 year
-10%
2 years
-14%
3 years
+2.8%
4 years
+7.3%
5 years
+1.6%
6 years
+30%
7 years
+19%
8 years
+40%
9 years
+32%
10 years
+52%
11 years
+49%
The price per m² of houses has decreased by 14% since 2 years, but it has increased by 52% in 10 years.

Yearly evolution

Evolution of the median price per m²

Evolution of the median price per m² - 35 - La Richardais

Evolution of the number of transactions

Warning, last year incomplete. Projections made based on the proportions between semesters of the previous year at the departmental/national level and by type of property.

Evolution of the number of transactions - 35 - La Richardais

Yearly data

Descending order
Year
Houses
house
transactions
Houses
house
Price per m²
Apartments
apt.
transactions
Apartments
apt.
Price per m²
2025
11
2 974 
0
--- 
2024
31
3 317 
8
4 090 
2023
15
3 469 
12
3 797 
2022
37
2 894 
10
3 695 
2021
29
2 771 
10
2 746 
2020
41
2 926 
7
2 933 
2019
33
2 283 
9
2 156 
2018
27
2 500 
3
2 919 
2017
42
2 128 
5
2 217 
2016
24
2 246 
7
2 368 
2015
25
1 957 
6
2 086 
2014
21
2 000 
4
1 728 

Analysis

Structure of prices per m²

Values of price percentiles per m² over the periods used for the estimated price of each type of property.

Structure of transaction amounts

Values of transaction amounts percentiles over the periods used for the estimated price of each type of property.

Transaction amounts and prices per m² by percentile

Ascending order
Percentile
Houses
house
Price per m²
Houses
house
Transaction amount
Apartments
apt.
Price per m²
Apartments
apt.
Transaction amount
10th percentile
2 324 
213 K
2 426 
87 890 
20th percentile
2 824 
257 K
3 220 
107 K
30th percentile
3 113 
308 K
3 395 
134 K
40th percentile
3 296 
341 K
3 594 
141 K
50th percentile
3 857 
385 K
4 011 
158 K
60th percentile
3 984 
472 K
4 214 
182 K
70th percentile
4 171 
566 K
4 566 
192 K
80th percentile
4 535 
613 K
4 677 
238 K
90th percentile
5 271 
742 K
5 010 
339 K

National and departmental comparison

Evolution of the median price per m² of houses

Evolution of the median price per m² of apartments

Quarterly evolution

Evolution of the median price per m²

Evolution of the number of transactions

Quarterly data

Descending order
Quarter
Houses
house
transactions
Houses
house
Price per m²
Apartments
apt.
transactions
Apartments
apt.
Price per m²
2025 Q2
2
4 879 
0
--- 
2025 Q1
9
2 907 
0
--- 
2024 Q4
9
3 922 
2
3 938 
2024 Q3
9
3 911 
2
2 288 
2024 Q2
6
3 334 
4
4 425 
2024 Q1
7
2 915 
0
--- 
2023 Q4
6
3 313 
0
--- 
2023 Q3
3
3 482 
2
2 897 
2023 Q2
4
3 450 
6
4 122 
2023 Q1
2
4 461 
4
3 831 
2022 Q4
7
3 397 
6
4 020 
2022 Q3
5
4 186 
1
4 545 
2022 Q2
12
2 812 
2
2 247 
2022 Q1
13
2 810 
1
4 000 
2021 Q4
11
3 571 
2
3 028 
2021 Q3
3
2 771 
2
3 612 
2021 Q2
11
2 692 
3
3 093 
2021 Q1
4
1 652 
3
2 635 
2020 Q4
9
3 376 
0
--- 
2020 Q3
14
2 830 
3
2 955 
2020 Q2
9
3 096 
1
3 400 
2020 Q1
9
2 155 
3
1 992 
2019 Q4
10
3 132 
1
576 
2019 Q3
6
2 381 
2
2 056 
2019 Q2
10
2 152 
3
2 247 
2019 Q1
7
2 050 
3
2 119 
2018 Q4
11
2 244 
1
1 688 
2018 Q3
6
3 008 
1
3 409 
2018 Q2
7
2 500 
0
--- 
2018 Q1
3
3 136 
1
2 919 
2017 Q4
8
2 029 
2
2 455 
2017 Q3
11
1 959 
1
1 778 
2017 Q2
15
2 167 
1
2 103 
2017 Q1
8
2 165 
1
2 304 
2016 Q4
12
2 508 
1
2 500 
2016 Q3
5
1 978 
2
2 270 
2016 Q2
2
2 244 
3
2 340 
2016 Q1
5
2 205 
1
2 368 
2015 Q4
6
1 610 
2
1 664 
2015 Q3
10
2 070 
1
1 938 
2015 Q2
3
2 155 
2
2 108 
2015 Q1
6
1 498 
1
2 103 
2014 Q4
4
2 480 
1
1 675 
2014 Q3
5
2 195 
2
1 738 
2014 Q2
8
1 870 
0
--- 
2014 Q1
4
2 148 
1
1 782 

Overview of the latest real estate transactions

The following list is an anonymized overview of the latest transactions. For more details and to find all transactions, please use the map to view transactions by plot or the transaction search page for a search by criteria.

2025-06-11
182 000 
Sale
Land
550 m2
-Terrains à bâtir
Land
662 m2
-Terrains à bâtir
2025-06-06
725 000 
1 928  /m²(376 m²)
Sale
Commercial property
376 m2
Land
1286 m2
-Terrains d'agrément
Land
1000 m2
-Sols
Land
159 m2
-Prés
Land
2831 m2
-Terrains à bâtir
Land
85 m2
-Prés
Land
187 m2
-Sols
2025-06-05
237 000 
5 267  /m²(45 m²)
Sale
Houses
House
3 rooms
45 m2
1 outbuilding
Land
486 m2
-Sols
2025-04-10
476 000 
4 491  /m²(106 m²)
Sale
Houses
House
5 rooms
106 m2
Land
739 m2
-Sols
2025-03-27
282 000 
2 907  /m²(97 m²)
Sale
Houses
House
5 rooms
97 m2
Land
301 m2
-Sols
2025-03-26
270 000 
3 857  /m²(70 m²)
Sale
Houses
House
3 rooms
70 m2
1 outbuilding
Land
625 m2
-Sols
2025-03-26
150 000 
2 500  /m²(60 m²)
Sale
Houses
House
3 rooms
60 m2
Land
52 m2
-Sols
2025-02-28
414 000 
1 754  /m²(236 m²)
Sale
Houses
House
1 room
25 m2
Houses
House
2 rooms
60 m2
2 outbuildings
Land
581 m2
-Sols
Houses
House
6 rooms
151 m2
3 outbuildings
Land
562 m2
-Sols
2025-02-25
729 000 
4 190  /m²(174 m²)
Sale
Houses
House
6 rooms
174 m2
Land
995 m2
-Sols
Land
57 m2
-Taillis simples
Land
242 m2
-Taillis simples
2025-02-21
504 000 
Sale
Land
70 m2
-Terres
Land
776 m2
-Sols
2025-02-03
227 000 
2 316  /m²(98 m²)
Sale
Houses
House
5 rooms
98 m2
Land
346 m2
-Sols
2025-01-31
530 000 
1 667  /m²(318 m²)
Sale
Land
38 m2
-Terrains d'agrément
Houses
House
11 rooms
318 m2
2 outbuildings
Land
1169 m2
-Sols
2025-01-30
190 000 
Sale
1 outbuilding
Land
1000 m2
-Sols
2025-01-30
230 000 
295  /m²(780 m²)
2 190  /m²(105 m²)
Sale
Houses
House
5 rooms
105 m2
Commercial property
110 m2
Commercial property
565 m2
Land
1440 m2
-Sols
2025-01-29
88 000 
transaction.nature.Vente terrain à bâtir
Land
128 m2
-Terrains à bâtir
2025-01-21
455 000 
2 974  /m²(153 m²)
Sale
Houses
House
6 rooms
153 m2
Land
700 m2
-Sols
2025-01-20
53 000 
Sale
Land
866 m2
-Terrains d'agrément
Land
53 m2
-Sols
2025-01-02
795 500 
5 449  /m²(146 m²)
Sale
Houses
House
6 rooms
146 m2
1 outbuilding
Land
605 m2
-Terrains à bâtir
Land
1116 m2
-Terrains à bâtir
2024-12-31
215 957 
2 699  /m²(80 m²)
Sale
Houses
House
4 rooms
80 m2
Land
254 m2
-Sols
2024-12-19
1 000 
Sale
Land
817 m2
-Terres
Land
562 m2
-Terres
Land
13 m2
-Terres
799 transactions listed in the municipality

Ille-et-Vilaine (35)

Most expensive cities

City
name
Descending orderHouses
house
Price per m²
5 682 
5 538 
4 545 
4 504 
4 150 
4 118 
3 857 
3 721 
3 714 
City
name
Descending orderApartments
apt.
Price per m²
5 306 
5 061 
4 627 
4 194 
4 011 
3 914 
3 835 
3 755 

Least expensive cities

City
name
Ascending orderHouses
house
Price per m²
982 
1 041 
1 047 
1 111 
1 125 
1 128 
1 150 
City
name
Ascending orderApartments
apt.
Price per m²
238 
267 
315 
352