emooki
HomePrice mapTransactions
🇬🇧 English🇫🇷 Français🇩🇪 Deutsch🇪🇸 Español🇮🇹 Italiano

Real estate price map


Real estate price map in the municipality of La Gouesnière.

Ille-et-Vilaine (35)
La Gouesnière

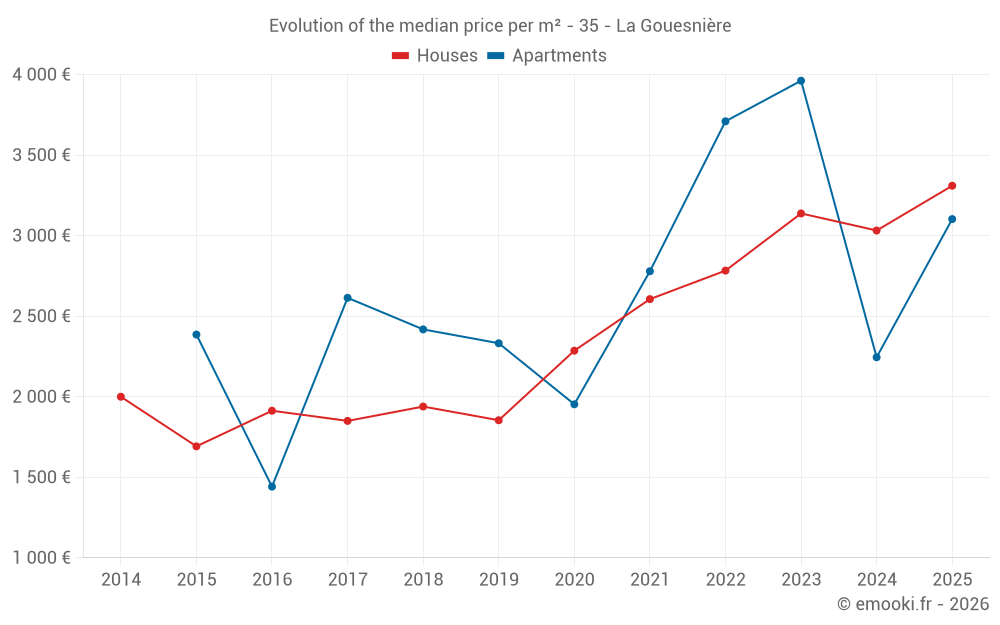
Median price of real estate
in the municipality of La Gouesnière

HousesHouses
2 991  /m²
1-23-45-67-89-10
Reliability 8/10
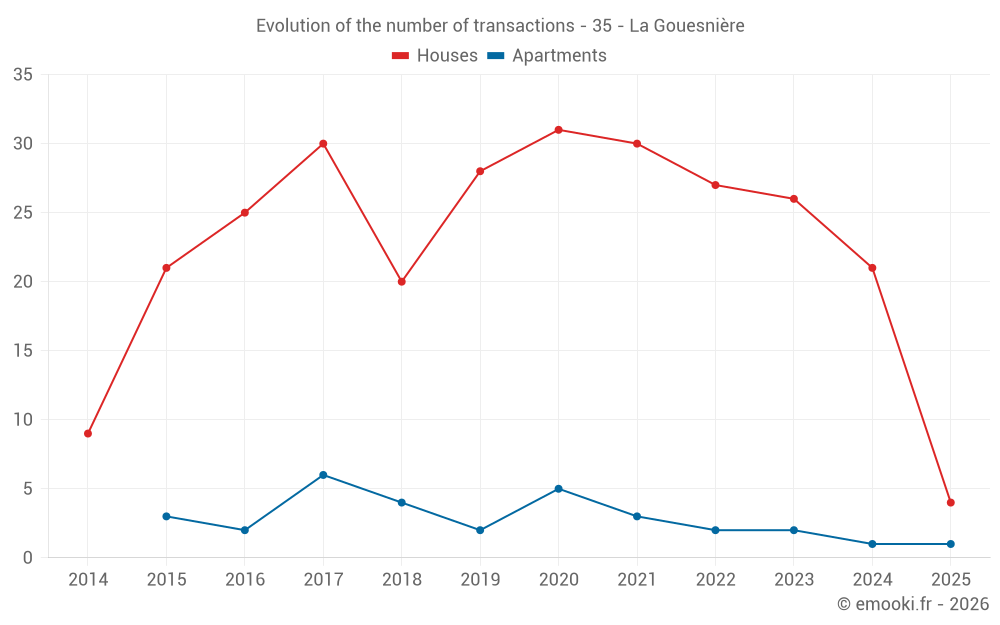
Median price on the 16 transactions of the last 12 months.
from 2 533 to
3 244  /m²
60% of transactions from the 2nd to the 8th deciles.
ApartmentsApartments
2 983  /m²
1-23-45-67-89-10
Reliability 4/10
Median price on the 10 transactions of the last 60 months.
DwellingsDwellings
2 991  /m²
1-23-45-67-89-10
Reliability 8/10
Median price on the 18 transactions of the last 12 months.
from 2 360 to
3 196  /m²
60% of transactions from the 2nd to the 8th deciles.
HousesEvolution of the price per m² of houses since...
1 year
--
2 years
--
3 years
--
4 years
--
5 years
--
6 years
--
7 years
--
8 years
--
9 years
--
10 years
--
11 years
--
ApartmentsEvolution of the price per m² of apartments since...
1 year
--
2 years
--
3 years
--
4 years
--
5 years
--
6 years
--
7 years
--
8 years
--
9 years
--
10 years
--
11 years
--

Yearly evolution

Evolution of the median price per m²

Evolution of the number of transactions

Warning, last year incomplete. Projections made based on the proportions between semesters of the previous year at the departmental/national level and by type of property.

Yearly data

Descending order
Year
Houses
house
transactions
Houses
house
Price per m²
Apartments
apt.
transactions
Apartments
apt.
Price per m²
2025
4
3 310 
1
3 103 
2024
21
3 032 
1
2 245 
2023
26
3 138 
2
3 962 
2022
27
2 783 
2
3 710 
2021
30
2 606 
3
2 779 
2020
31
2 286 
5
1 953 
2019
28
1 854 
2
2 332 
2018
20
1 939 
4
2 418 
2017
30
1 850 
6
2 614 
2016
25
1 913 
2
1 442 
2015
21
1 692 
3
2 386 
2014
9
2 000 
0
--- 

Analysis

Structure of prices per m²

Values of price percentiles per m² over the periods used for the estimated price of each type of property.

Structure of transaction amounts

Values of transaction amounts percentiles over the periods used for the estimated price of each type of property.

Transaction amounts and prices per m² by percentile

Ascending order
Percentile
Houses
house
Price per m²
Houses
house
Transaction amount
Apartments
apt.
Price per m²
Apartments
apt.
Transaction amount
10th percentile
1 922 
130 K
2 121 
87 440 
20th percentile
2 533 
210 K
2 225 
95 800 
30th percentile
2 902 
255 K
2 619 
106 K
40th percentile
2 921 
270 K
2 829 
113 K
50th percentile
2 991 
283 K
2 983 
118 K
60th percentile
3 032 
285 K
3 257 
135 K
70th percentile
3 110 
332 K
3 592 
158 K
80th percentile
3 244 
344 K
3 853 
164 K
90th percentile
3 606 
403 K
3 948 
178 K

National and departmental comparison

Evolution of the median price per m² of houses

Evolution of the median price per m² of apartments

Quarterly evolution

Evolution of the median price per m²

Evolution of the number of transactions

Quarterly data

Descending order
Quarter
Houses
house
transactions
Houses
house
Price per m²
Apartments
apt.
transactions
Apartments
apt.
Price per m²
2025 Q1
4
3 310 
1
3 103 
2024 Q4
5
2 967 
1
2 245 
2024 Q3
7
2 887 
0
--- 
2024 Q2
7
3 125 
0
--- 
2024 Q1
2
4 094 
0
--- 
2023 Q4
6
3 287 
0
--- 
2023 Q3
10
2 975 
0
--- 
2023 Q2
4
2 344 
1
4 091 
2023 Q1
6
3 668 
1
3 833 
2022 Q4
9
3 244 
1
3 489 
2022 Q3
6
2 656 
1
3 932 
2022 Q2
3
3 780 
0
--- 
2022 Q1
9
2 247 
0
--- 
2021 Q4
7
2 692 
0
--- 
2021 Q3
9
2 692 
1
2 863 
2021 Q2
7
2 575 
2
2 463 
2021 Q1
7
2 523 
0
--- 
2020 Q4
5
2 717 
1
1 886 
2020 Q3
9
2 414 
0
--- 
2020 Q2
8
2 038 
2
2 271 
2020 Q1
9
2 286 
2
2 301 
2019 Q4
2
1 768 
0
--- 
2019 Q3
14
2 108 
0
--- 
2019 Q2
3
1 660 
1
1 821 
2019 Q1
9
1 600 
1
2 844 
2018 Q4
4
2 139 
1
2 439 
2018 Q3
2
1 555 
0
--- 
2018 Q2
5
1 298 
1
1 698 
2018 Q1
9
2 092 
2
2 434 
2017 Q4
7
1 754 
5
2 604 
2017 Q3
7
1 964 
1
2 625 
2017 Q2
9
1 879 
0
--- 
2017 Q1
7
1 489 
0
--- 
2016 Q4
5
2 092 
1
1 653 
2016 Q3
6
1 988 
0
--- 
2016 Q2
8
1 712 
1
1 230 
2016 Q1
6
1 695 
0
--- 
2015 Q4
3
2 069 
1
2 821 
2015 Q3
4
1 758 
1
2 386 
2015 Q2
8
1 771 
1
1 742 
2015 Q1
6
1 384 
0
--- 
2014 Q4
1
2 051 
0
--- 
2014 Q3
3
1 427 
0
--- 
2014 Q2
4
1 955 
0
--- 
2014 Q1
1
2 000 
0
--- 

Ille-et-Vilaine (35)

Most expensive cities

City
name
Descending orderHouses
house
Price per m²
5 682 
5 538 
4 545 
4 504 
4 150 
4 118 
3 857 
3 721 
3 714 
City
name
Descending orderApartments
apt.
Price per m²
5 306 
5 061 
4 627 
4 194 
4 011 
3 914 
3 835 
3 755 

Least expensive cities

City
name
Ascending orderHouses
house
Price per m²
982 
1 041 
1 047 
1 111 
1 125 
1 128 
1 150 
City
name
Ascending orderApartments
apt.
Price per m²
238 
267 
315 
352