emooki
HomePrice mapTransactions
🇬🇧 English🇫🇷 Français🇩🇪 Deutsch🇪🇸 Español🇮🇹 Italiano

Real estate price map


Real estate price map in the municipality of Saint-Armel, choose a section to see transactions by parcel.

Ille-et-Vilaine (35)

Saint-Armel - Real estate price m²

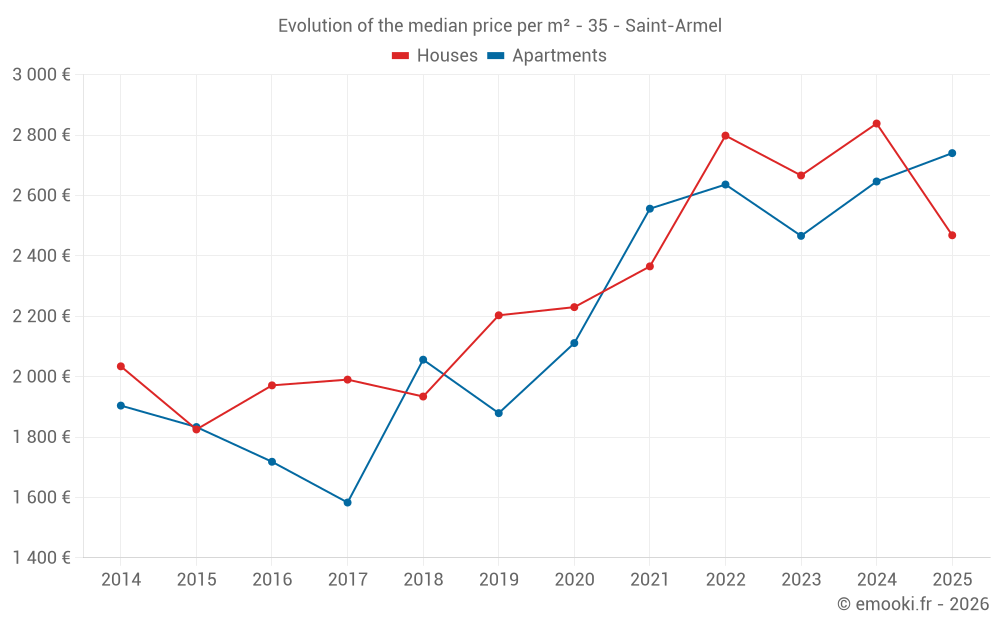
Median price of real estate
in the municipality of Saint-Armel

HousesHouses
2 541  /m²
1-23-45-67-89-10
Reliability 8/10
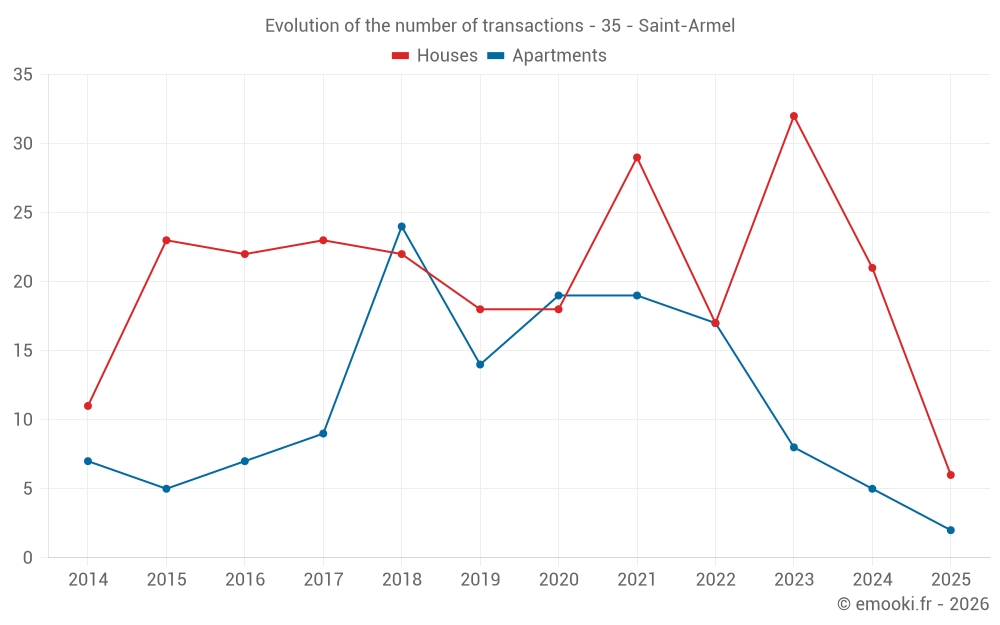
Median price on the 17 transactions of the last 12 months.
from 2 143 to
2 790  /m²
60% of transactions from the 2nd to the 8th deciles.
ApartmentsApartments
2 646  /m²
1-23-45-67-89-10
Reliability 6/10
Median price on the 23 transactions of the last 36 months.
from 2 324 to
2 894  /m²
60% of transactions from the 2nd to the 8th deciles.
DwellingsDwellings
2 654  /m²
1-23-45-67-89-10
Reliability 8/10
Median price on the 22 transactions of the last 12 months.
from 2 289 to
2 891  /m²
60% of transactions from the 2nd to the 8th deciles.
HousesEvolution of the price per m² of houses since...
1 year
-13%
2 years
-7.4%
3 years
-12%
4 years
+4.4%
5 years
+11%
6 years
+12%
7 years
+28%
8 years
+24%
9 years
+25%
10 years
+35%
11 years
+21%
The price per m² of houses has decreased by 13% since 1 year, but it has increased by 35% in 10 years.

Yearly evolution

Evolution of the median price per m²

Evolution of the median price per m² - 35 - Saint-Armel

Evolution of the number of transactions

Warning, last year incomplete. Projections made based on the proportions between semesters of the previous year at the departmental/national level and by type of property.

Evolution of the number of transactions - 35 - Saint-Armel

Yearly data

Descending order
Year
Houses
house
transactions
Houses
house
Price per m²
Apartments
apt.
transactions
Apartments
apt.
Price per m²
2025
6
2 468 
2
2 740 
2024
21
2 838 
5
2 646 
2023
32
2 666 
8
2 466 
2022
17
2 798 
17
2 636 
2021
29
2 365 
19
2 556 
2020
18
2 230 
19
2 111 
2019
18
2 203 
14
1 879 
2018
22
1 934 
24
2 056 
2017
23
1 990 
9
1 583 
2016
22
1 971 
7
1 718 
2015
23
1 825 
5
1 833 
2014
11
2 034 
7
1 904 

Analysis

Structure of prices per m²

Values of price percentiles per m² over the periods used for the estimated price of each type of property.

Structure of transaction amounts

Values of transaction amounts percentiles over the periods used for the estimated price of each type of property.

Transaction amounts and prices per m² by percentile

Ascending order
Percentile
Houses
house
Price per m²
Houses
house
Transaction amount
Apartments
apt.
Price per m²
Apartments
apt.
Transaction amount
10th percentile
1 986 
249 K
2 103 
117 K
20th percentile
2 143 
276 K
2 324 
129 K
30th percentile
2 398 
288 K
2 431 
137 K
40th percentile
2 472 
297 K
2 514 
150 K
50th percentile
2 541 
307 K
2 646 
156 K
60th percentile
2 661 
310 K
2 674 
166 K
70th percentile
2 700 
315 K
2 789 
173 K
80th percentile
2 790 
338 K
2 894 
178 K
90th percentile
3 175 
408 K
3 072 
189 K

National and departmental comparison

Evolution of the median price per m² of houses

Evolution of the median price per m² of apartments

Quarterly evolution

Evolution of the median price per m²

Evolution of the number of transactions

Quarterly data

Descending order
Quarter
Houses
house
transactions
Houses
house
Price per m²
Apartments
apt.
transactions
Apartments
apt.
Price per m²
2025 Q2
1
2 435 
0
--- 
2025 Q1
5
2 500 
2
2 740 
2024 Q4
8
2 608 
2
3 175 
2024 Q3
3
2 648 
1
2 646 
2024 Q2
5
2 976 
1
2 431 
2024 Q1
5
3 000 
1
2 206 
2023 Q4
10
2 624 
1
2 077 
2023 Q3
7
2 777 
2
2 304 
2023 Q2
8
2 529 
1
2 889 
2023 Q1
7
2 750 
4
2 466 
2022 Q4
6
2 818 
2
3 072 
2022 Q3
2
2 590 
6
2 486 
2022 Q2
7
2 798 
6
2 638 
2022 Q1
2
2 612 
3
2 963 
2021 Q4
10
2 512 
5
2 567 
2021 Q3
4
2 914 
4
2 479 
2021 Q2
6
2 206 
8
2 559 
2021 Q1
9
2 315 
2
2 439 
2020 Q4
5
2 328 
5
2 114 
2020 Q3
5
2 315 
4
2 101 
2020 Q2
4
1 920 
6
2 184 
2020 Q1
4
2 180 
4
1 868 
2019 Q4
3
2 109 
0
--- 
2019 Q3
11
2 297 
6
1 906 
2019 Q2
0
--- 
5
1 795 
2019 Q1
4
2 346 
3
1 879 
2018 Q4
4
1 910 
2
1 974 
2018 Q3
5
1 949 
6
2 004 
2018 Q2
10
1 879 
8
2 056 
2018 Q1
3
2 079 
8
2 018 
2017 Q4
9
2 157 
4
1 613 
2017 Q3
4
2 003 
1
1 449 
2017 Q2
5
1 613 
2
1 473 
2017 Q1
5
1 849 
2
1 806 
2016 Q4
6
2 100 
1
2 190 
2016 Q3
10
1 963 
1
1 718 
2016 Q2
4
1 940 
3
1 522 
2016 Q1
2
1 646 
2
2 074 
2015 Q4
5
1 658 
0
--- 
2015 Q3
6
1 774 
2
1 880 
2015 Q2
7
1 945 
2
1 976 
2015 Q1
5
1 825 
1
1 547 
2014 Q4
4
2 316 
0
--- 
2014 Q3
3
2 124 
2
1 850 
2014 Q2
1
543 
2
1 896 
2014 Q1
3
1 789 
3
1 943 

Overview of the latest real estate transactions

The following list is an anonymized overview of the latest transactions. For more details and to find all transactions, please use the map to view transactions by plot or the transaction search page for a search by criteria.

2025-06-27
67 000 
Sale
Land
95 m2
-Terrains à bâtir
Land
172 m2
-Terrains à bâtir
2025-06-23
66 000 
Sale
Land
95 m2
-Terrains à bâtir
Land
167 m2
-Terrains à bâtir
2025-05-19
280 000 
2 435  /m²(115 m²)
Sale
Houses
House
5 rooms
115 m2
Land
325 m2
-Sols
2025-04-30
300 000 
667  /m²(450 m²)
Sale
Commercial property
450 m2
Land
3122 m2
-Terres
Land
1400 m2
-Sols
Land
116 m2
-Terres
Land
908 m2
-Terres
2025-03-28
735 000 
4 106  /m²(179 m²)
Sale
Houses
House
6 rooms
179 m2
2 outbuildings
Land
712 m2
-Terrains d'agrément
Land
800 m2
-Sols
2025-03-28
172 000 
2 820  /m²(61 m²)
Sale
Apartments
Apartment
3 rooms
61 m2
2 outbuildings
2025-03-21
4 800 
Sale
Land
9211 m2
-Terres
2025-03-21
420 000 
2 500  /m²(168 m²)
Sale
Houses
House
7 rooms
168 m2
Land
594 m2
-Sols
2025-03-14
311 000 
2 006  /m²(155 m²)
Sale
Houses
House
6 rooms
155 m2
2025-03-12
8 000 
Sale
Land
2828 m2
-Prés
Land
5251 m2
-Terres
2025-02-20
117 000 
2 659  /m²(44 m²)
Sale
Apartments
Apartment
2 rooms
44 m2
1 outbuilding
2025-02-14
100 000 
Sale
Land
770 m2
-Terrains à bâtir
2025-02-13
309 000 
2 116  /m²(146 m²)
Sale
Houses
House
7 rooms
146 m2
Land
574 m2
-Sols
2025-01-10
275 000 
2 670  /m²(103 m²)
Sale
Houses
House
3 rooms
80 m2
Houses
House
1 room
23 m2
4 outbuildings
2024-12-27
240 950 
2 252  /m²(107 m²)
Sale
Houses
House
5 rooms
107 m2
Land
185 m2
-Terrains à bâtir
2024-12-23
80 000 
Sale
1 outbuilding
Land
117 m2
-Sols
Land
271 m2
-Jardins
/Jardin potager
2024-12-20
290 000 
2 762  /m²(105 m²)
Sale
Houses
House
5 rooms
105 m2
Land
420 m2
-Sols
2024-12-20
58 000 
468  /m²(124 m²)
Sale
Houses
House
3 rooms
124 m2
Land
192 m2
-Sols
Land
187 m2
-Sols
2024-12-20
128 000 
2 909  /m²(44 m²)
Sale
Apartments
Apartment
2 rooms
44 m2
1 outbuilding
1 outbuilding
2024-12-18
69 500 
Sale
Land
103 m2
-Terrains à bâtir
Land
173 m2
-Terrains à bâtir
702 transactions listed in the municipality

Ille-et-Vilaine (35)

Most expensive cities

City
name
Descending orderHouses
house
Price per m²
5 682 
5 538 
4 545 
4 504 
4 150 
4 118 
3 857 
3 721 
3 714 
City
name
Descending orderApartments
apt.
Price per m²
5 306 
5 061 
4 627 
4 194 
4 011 
3 914 
3 835 
3 755 

Least expensive cities

City
name
Ascending orderHouses
house
Price per m²
982 
1 041 
1 047 
1 111 
1 125 
1 128 
1 150 
City
name
Ascending orderApartments
apt.
Price per m²
238 
267 
315 
352