emooki
HomePrice mapTransactions
🇬🇧 English🇫🇷 Français🇩🇪 Deutsch🇪🇸 Español🇮🇹 Italiano

Real estate price map


Real estate price map in the municipality of Corps-Nuds, choose a section to see transactions by parcel.

Ille-et-Vilaine (35)

Corps-Nuds - Real estate price m²

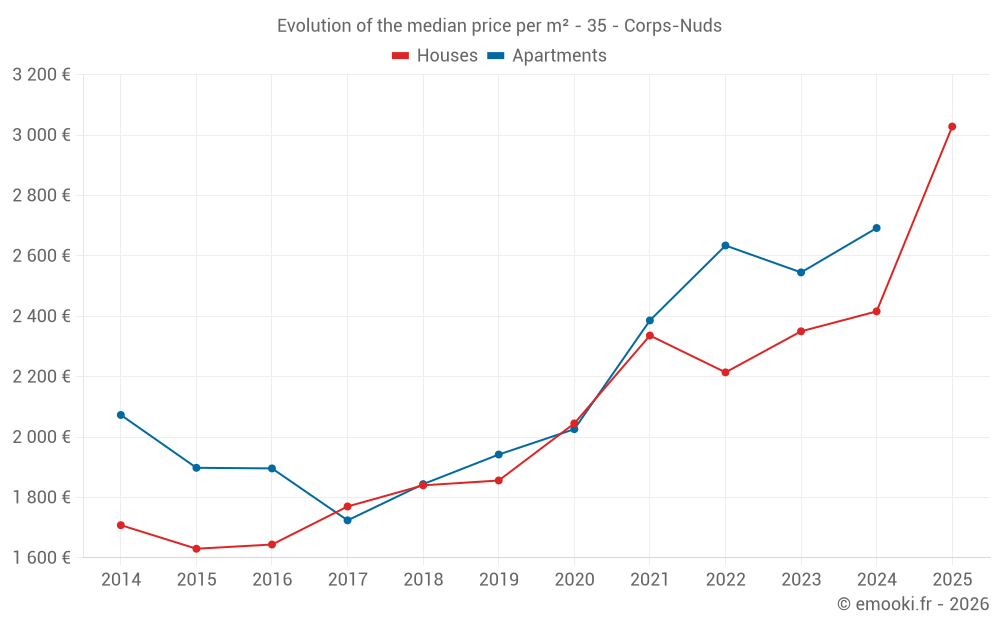
Median price of real estate
in the municipality of Corps-Nuds

HousesHouses
2 564  /m²
1-23-45-67-89-10
Reliability 8/10
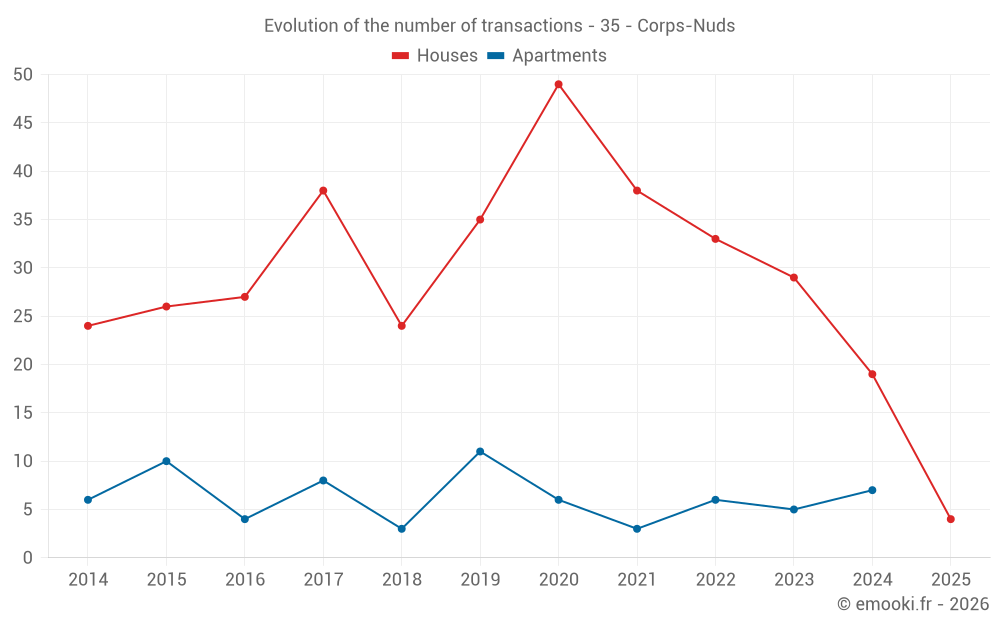
Median price on the 16 transactions of the last 12 months.
from 2 173 to
2 982  /m²
60% of transactions from the 2nd to the 8th deciles.
ApartmentsApartments
2 634  /m²
1-23-45-67-89-10
Reliability 6/10
Median price on the 16 transactions of the last 36 months.
from 2 481 to
3 162  /m²
60% of transactions from the 2nd to the 8th deciles.
DwellingsDwellings
2 629  /m²
1-23-45-67-89-10
Reliability 8/10
Median price on the 20 transactions of the last 12 months.
from 2 247 to
2 990  /m²
60% of transactions from the 2nd to the 8th deciles.
HousesEvolution of the price per m² of houses since...
1 year
+25%
2 years
+29%
3 years
+37%
4 years
+30%
5 years
+48%
6 years
+63%
7 years
+65%
8 years
+71%
9 years
+84%
10 years
+86%
11 years
+77%

Yearly evolution

Evolution of the median price per m²

Evolution of the median price per m² - 35 - Corps-Nuds

Evolution of the number of transactions

Warning, last year incomplete. Projections made based on the proportions between semesters of the previous year at the departmental/national level and by type of property.

Evolution of the number of transactions - 35 - Corps-Nuds

Yearly data

Descending order
Year
Houses
house
transactions
Houses
house
Price per m²
Apartments
apt.
transactions
Apartments
apt.
Price per m²
2025
4
3 028 
0
--- 
2024
19
2 416 
7
2 692 
2023
29
2 350 
5
2 545 
2022
33
2 214 
6
2 634 
2021
38
2 336 
3
2 386 
2020
49
2 045 
6
2 026 
2019
35
1 856 
11
1 942 
2018
24
1 840 
3
1 844 
2017
38
1 770 
8
1 724 
2016
27
1 644 
4
1 896 
2015
26
1 630 
10
1 898 
2014
24
1 708 
6
2 073 

Analysis

Structure of prices per m²

Values of price percentiles per m² over the periods used for the estimated price of each type of property.

Structure of transaction amounts

Values of transaction amounts percentiles over the periods used for the estimated price of each type of property.

Transaction amounts and prices per m² by percentile

Ascending order
Percentile
Houses
house
Price per m²
Houses
house
Transaction amount
Apartments
apt.
Price per m²
Apartments
apt.
Transaction amount
10th percentile
1 732 
113 K
2 372 
129 K
20th percentile
2 173 
170 K
2 481 
145 K
30th percentile
2 267 
213 K
2 563 
148 K
40th percentile
2 416 
246 K
2 590 
160 K
50th percentile
2 564 
261 K
2 634 
163 K
60th percentile
2 703 
281 K
2 692 
168 K
70th percentile
2 902 
292 K
2 933 
174 K
80th percentile
2 982 
295 K
3 162 
175 K
90th percentile
3 254 
390 K
3 248 
198 K

National and departmental comparison

Evolution of the median price per m² of houses

Evolution of the median price per m² of apartments

Quarterly evolution

Evolution of the median price per m²

Evolution of the number of transactions

Quarterly data

Descending order
Quarter
Houses
house
transactions
Houses
house
Price per m²
Apartments
apt.
transactions
Apartments
apt.
Price per m²
2025 Q2
2
3 760 
0
--- 
2025 Q1
2
2 486 
0
--- 
2024 Q4
5
2 416 
1
2 692 
2024 Q3
7
2 450 
3
2 581 
2024 Q2
4
2 246 
2
2 857 
2024 Q1
3
2 817 
1
3 318 
2023 Q4
5
2 394 
1
2 273 
2023 Q3
8
2 694 
0
--- 
2023 Q2
8
2 004 
1
3 162 
2023 Q1
8
2 260 
3
2 545 
2022 Q4
8
2 266 
2
2 742 
2022 Q3
11
2 578 
2
2 609 
2022 Q2
5
2 388 
1
2 996 
2022 Q1
9
1 872 
1
2 277 
2021 Q4
8
2 350 
1
1 538 
2021 Q3
12
2 207 
0
--- 
2021 Q2
9
2 125 
1
2 386 
2021 Q1
9
2 444 
1
2 425 
2020 Q4
12
2 061 
4
2 058 
2020 Q3
16
2 084 
0
--- 
2020 Q2
12
1 860 
1
2 000 
2020 Q1
9
1 804 
1
1 904 
2019 Q4
16
1 900 
3
2 024 
2019 Q3
7
1 760 
3
1 894 
2019 Q2
4
2 066 
2
1 636 
2019 Q1
8
1 714 
3
1 975 
2018 Q4
5
1 846 
0
--- 
2018 Q3
7
1 929 
1
1 844 
2018 Q2
4
1 868 
2
1 397 
2018 Q1
8
1 688 
0
--- 
2017 Q4
10
1 790 
2
1 388 
2017 Q3
11
1 711 
1
758 
2017 Q2
11
1 818 
2
1 925 
2017 Q1
6
1 951 
3
2 046 
2016 Q4
9
1 606 
1
2 027 
2016 Q3
6
1 760 
0
--- 
2016 Q2
4
1 684 
1
1 905 
2016 Q1
8
1 771 
2
1 874 
2015 Q4
11
1 196 
3
1 500 
2015 Q3
7
1 559 
5
1 914 
2015 Q2
2
1 930 
2
1 975 
2015 Q1
6
1 784 
0
--- 
2014 Q4
4
1 122 
3
2 077 
2014 Q3
6
1 756 
2
2 064 
2014 Q2
9
1 915 
1
2 442 
2014 Q1
5
1 716 
0
--- 

Overview of the latest real estate transactions

The following list is an anonymized overview of the latest transactions. For more details and to find all transactions, please use the map to view transactions by plot or the transaction search page for a search by criteria.

2025-06-24
3 730 
Exchange
Land
28 m2
-Terres
2025-06-24
4 795 
Exchange
Land
16 m2
-Terres
Land
20 m2
-Terres
2025-06-24
275 000 
3 354  /m²(82 m²)
Sale
Houses
House
3 rooms
82 m2
Land
2360 m2
-Terres
Land
500 m2
-Sols
2025-05-14
44 544 
Sale
Land
256 m2
-Terrains à bâtir
2025-04-22
625 000 
4 167  /m²(150 m²)
Sale
Houses
House
8 rooms
150 m2
2 outbuildings
Land
1151 m2
-Sols
Land
1969 m2
-Jardins
/Jardin potager
2025-03-21
1 200 
Sale
1 outbuilding
2025-03-14
200 000 
2 703  /m²(74 m²)
Sale
Houses
House
3 rooms
74 m2
Land
490 m2
-Sols
2025-03-10
65 026 
Sale
Land
27 m2
-Terrains à bâtir
Land
173 m2
-Terrains à bâtir
Land
153 m2
-Terrains à bâtir
Land
26 m2
-Terrains à bâtir
Land
193 m2
-Terrains à bâtir
Land
154 m2
-Terrains à bâtir
2025-03-04
95 000 
Sale
Land
202 m2
-Terrains à bâtir
Land
116 m2
-Terrains à bâtir
Land
35 m2
-Terrains à bâtir
2025-02-25
5 200 
Sale
Land
3880 m2
-Terres
2025-02-03
9 000 
Sale
Land
52 m2
-Jardins
/Jardin potager
2025-01-29
1 200 000 
1 235  /m²(972 m²)
Sale
Commercial property
972 m2
Land
16264 m2
-Terrains à bâtir
Land
124 m2
-Terrains à bâtir
2025-01-29
6 000 
Sale
Land
2790 m2
-Terres
2025-01-27
10 000 
Sale
Land
151 m2
-Sols
Land
12989 m2
-Terres
2025-01-17
281 250 
2 268  /m²(124 m²)
Sale
Houses
House
5 rooms
124 m2
Land
322 m2
-Terrains à bâtir
2025-01-15
8 350 
Sale
Land
21260 m2
-Terres
2024-12-27
166 700 
Sale
Land
1921 m2
-Futaies feuillues
Land
1240 m2
-Taillis simples
Land
50681 m2
-Terres
Land
5282 m2
-Prés
Land
1795 m2
-Vergers
/CIDRE
Land
50680 m2
-Terres
Land
1801 m2
-Landes
Land
101900 m2
-Terres
Land
21675 m2
-Terres
Land
4620 m2
-Prés
2024-12-18
175 000 
2 692  /m²(65 m²)
Sale
Apartments
Apartment
3 rooms
65 m2
1 outbuilding
2024-12-05
139 577 
Sale
Land
2029 m2
-Terres
2024-12-04
170 000 
2 982  /m²(57 m²)
Sale
Houses
House
3 rooms
57 m2
1 outbuilding
Land
629 m2
-Sols
773 transactions listed in the municipality

Ille-et-Vilaine (35)

Most expensive cities

City
name
Descending orderHouses
house
Price per m²
5 682 
5 538 
4 545 
4 504 
4 150 
4 118 
3 857 
3 721 
3 714 
City
name
Descending orderApartments
apt.
Price per m²
5 306 
5 061 
4 627 
4 194 
4 011 
3 914 
3 835 
3 755 

Least expensive cities

City
name
Ascending orderHouses
house
Price per m²
982 
1 041 
1 047 
1 111 
1 125 
1 128 
1 150 
City
name
Ascending orderApartments
apt.
Price per m²
238 
267 
315 
352