emooki
HomePrice mapTransactions
🇬🇧 English🇫🇷 Français🇩🇪 Deutsch🇪🇸 Español🇮🇹 Italiano

Real estate price map


Real estate price map in the municipality of Poligné, choose a section to see transactions by parcel.

Ille-et-Vilaine (35)
Poligné

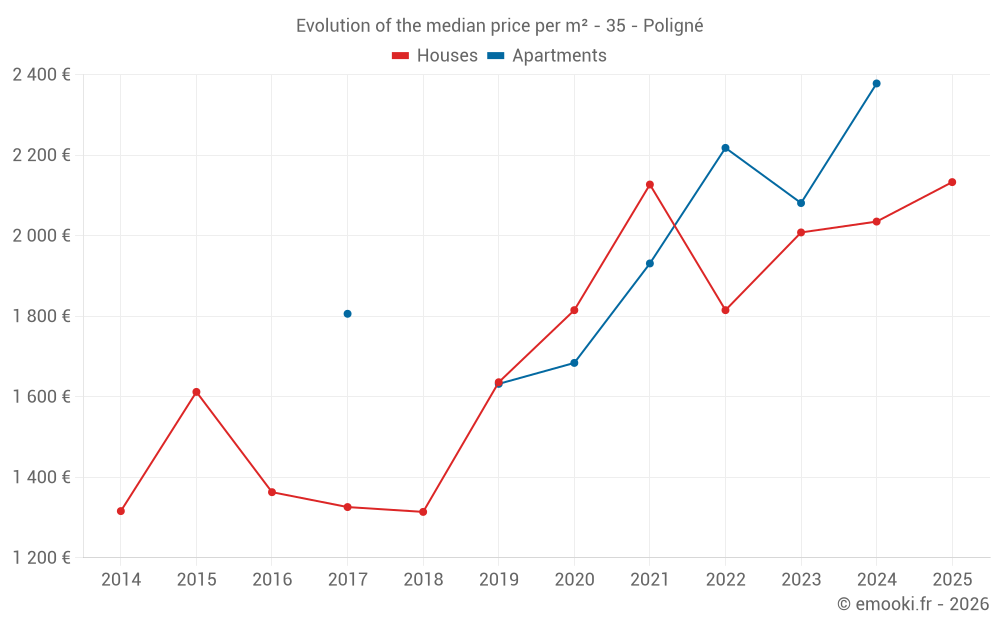
Median price of real estate
in the municipality of Poligné

HousesHouses
2 063  /m²
1-23-45-67-89-10
Reliability 7/10
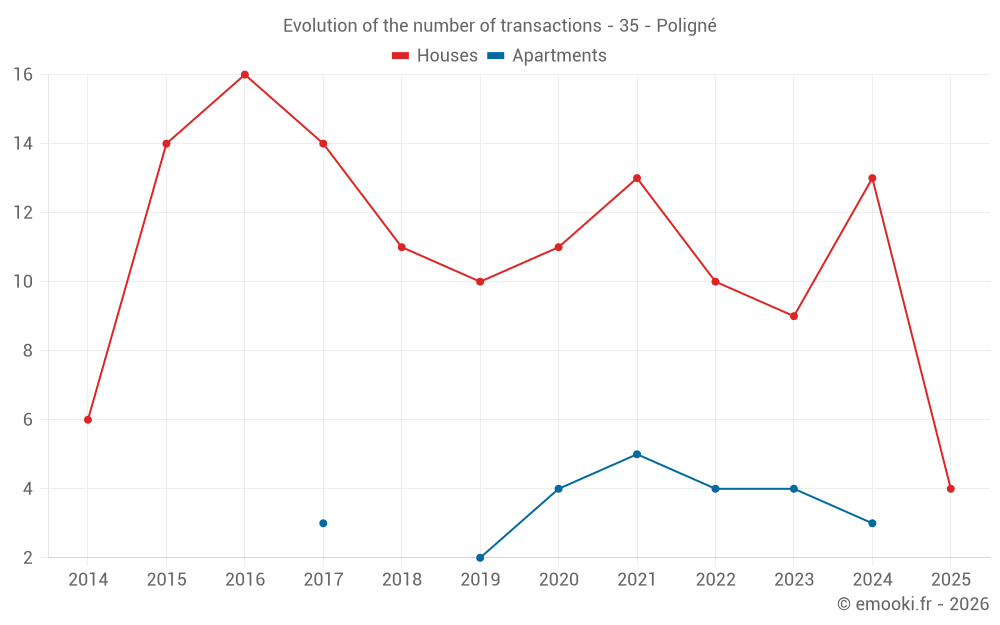
Median price on the 23 transactions of the last 24 months.
from 1 521 to
2 455  /m²
60% of transactions from the 2nd to the 8th deciles.
ApartmentsApartments
2 299  /m²
1-23-45-67-89-10
Reliability 5/10
Median price on the 12 transactions of the last 48 months.
from 2 086 to
2 371  /m²
60% of transactions from the 2nd to the 8th deciles.
DwellingsDwellings
2 083  /m²
1-23-45-67-89-10
Reliability 7/10
Median price on the 29 transactions of the last 24 months.
from 1 609 to
2 451  /m²
60% of transactions from the 2nd to the 8th deciles.
HousesEvolution of the price per m² of houses since...
1 year
+4.8%
2 years
+6.2%
3 years
+18%
4 years
+0.3%
5 years
+18%
6 years
+30%
7 years
+62%
8 years
+61%
9 years
+56%
10 years
+32%
11 years
+62%

Yearly evolution

Evolution of the median price per m²

Evolution of the number of transactions

Warning, last year incomplete. Projections made based on the proportions between semesters of the previous year at the departmental/national level and by type of property.

Yearly data

Descending order
Year
Houses
house
transactions
Houses
house
Price per m²
Apartments
apt.
transactions
Apartments
apt.
Price per m²
2025
4
2 133 
0
--- 
2024
13
2 035 
3
2 378 
2023
9
2 008 
4
2 081 
2022
10
1 815 
4
2 218 
2021
13
2 127 
5
1 931 
2020
11
1 815 
4
1 684 
2019
10
1 636 
2
1 632 
2018
11
1 314 
0
--- 
2017
14
1 326 
3
1 806 
2016
16
1 363 
0
--- 
2015
14
1 612 
0
--- 
2014
6
1 316 
0
--- 

Analysis

Structure of prices per m²

Values of price percentiles per m² over the periods used for the estimated price of each type of property.

Structure of transaction amounts

Values of transaction amounts percentiles over the periods used for the estimated price of each type of property.

Transaction amounts and prices per m² by percentile

Ascending order
Percentile
Houses
house
Price per m²
Houses
house
Transaction amount
Apartments
apt.
Price per m²
Apartments
apt.
Transaction amount
10th percentile
1 019 
102 K
2 007 
70 925 
20th percentile
1 521 
126 K
2 086 
79 400 
30th percentile
1 710 
150 K
2 148 
80 000 
40th percentile
2 001 
164 K
2 214 
80 320 
50th percentile
2 063 
215 K
2 299 
82 375 
60th percentile
2 186 
231 K
2 321 
86 380 
70th percentile
2 345 
242 K
2 339 
91 983 
80th percentile
2 455 
252 K
2 371 
93 938 
90th percentile
2 514 
302 K
2 390 
94 450 

National and departmental comparison

Evolution of the median price per m² of houses

Evolution of the median price per m² of apartments

Quarterly evolution

Evolution of the median price per m²

Evolution of the number of transactions

Quarterly data

Descending order
Quarter
Houses
house
transactions
Houses
house
Price per m²
Apartments
apt.
transactions
Apartments
apt.
Price per m²
2025 Q2
1
2 500 
0
--- 
2025 Q1
3
2 083 
0
--- 
2024 Q4
4
1 500 
2
2 589 
2024 Q3
3
2 035 
1
2 305 
2024 Q2
4
2 396 
0
--- 
2024 Q1
2
1 934 
0
--- 
2023 Q4
4
1 991 
1
2 000 
2023 Q3
2
2 203 
2
2 027 
2023 Q2
2
1 117 
1
2 342 
2023 Q1
1
2 213 
0
--- 
2022 Q4
2
1 816 
1
2 072 
2022 Q3
1
2 025 
0
--- 
2022 Q2
4
2 082 
2
2 237 
2022 Q1
3
1 563 
1
2 293 
2021 Q4
3
2 407 
1
2 391 
2021 Q3
4
2 173 
0
--- 
2021 Q2
3
2 127 
2
1 671 
2021 Q1
3
1 278 
2
2 035 
2020 Q4
2
2 036 
2
1 609 
2020 Q3
4
1 794 
0
--- 
2020 Q2
4
1 698 
1
1 750 
2020 Q1
1
2 307 
1
2 174 
2019 Q4
3
1 853 
1
1 556 
2019 Q3
4
1 640 
0
--- 
2019 Q2
2
964 
1
1 707 
2019 Q1
1
1 650 
0
--- 
2018 Q4
1
720 
0
--- 
2018 Q3
2
1 434 
0
--- 
2018 Q2
4
1 391 
0
--- 
2018 Q1
4
1 402 
0
--- 
2017 Q4
2
1 429 
0
--- 
2017 Q3
4
1 184 
1
1 512 
2017 Q2
3
1 490 
0
--- 
2017 Q1
5
1 238 
2
2 038 
2016 Q4
2
357 
0
--- 
2016 Q3
6
1 531 
0
--- 
2016 Q2
4
886 
0
--- 
2016 Q1
4
1 552 
0
--- 
2015 Q4
4
1 192 
0
--- 
2015 Q3
4
1 671 
0
--- 
2015 Q2
5
2 023 
0
--- 
2015 Q1
1
1 225 
0
--- 
2014 Q4
1
1 375 
0
--- 
2014 Q3
3
1 256 
0
--- 
2014 Q2
1
1 787 
0
--- 
2014 Q1
1
1 071 
0
--- 

Overview of the latest real estate transactions

The following list is an anonymized overview of the latest transactions. For more details and to find all transactions, please use the map to view transactions by plot or the transaction search page for a search by criteria.

2025-06-16
44 700 
Sale
Land
375 m2
-Terrains à bâtir
2025-06-14
56 000 
Sale
Land
406 m2
-Terrains à bâtir
2025-06-10
70 000 
Sale
Land
368 m2
-Jardins
/Jardin potager
Land
2080 m2
-Sols
Land
4696 m2
-Terres
Land
2348 m2
-Terres
2025-05-06
42 000 
Sale
Land
290 m2
-Terrains à bâtir
2025-05-05
245 000 
2 500  /m²(98 m²)
Sale
Houses
House
4 rooms
98 m2
Land
410 m2
-Terrains à bâtir
2025-03-26
701 246 
Sale
Land
308 m2
-Terrains à bâtir
Land
323 m2
-Terrains à bâtir
Land
328 m2
-Terrains à bâtir
Land
396 m2
-Terrains à bâtir
2025-03-21
55 000 
Sale
Land
405 m2
-Terrains à bâtir
2025-03-13
500 
Sale
Land
240 m2
-Sols
Land
866 m2
-Sols
2025-02-27
125 000 
2 083  /m²(60 m²)
Sale
Houses
House
4 rooms
60 m2
1 outbuilding
Land
1098 m2
-Sols
Land
599 m2
-Jardins
/Jardin potager
Land
8558 m2
-Futaies feuillues
Land
10941 m2
-Futaies feuillues
Land
606 m2
-Sols
2025-02-26
262 000 
2 183  /m²(120 m²)
Sale
2 outbuildings
Land
65 m2
-Sols
Houses
House
4 rooms
120 m2
Land
251 m2
-Sols
2025-01-28
109 500 
1 521  /m²(72 m²)
Sale
Houses
House
4 rooms
72 m2
2 outbuildings
Land
652 m2
-Sols
2024-12-31
88 000 
2 378  /m²(37 m²)
Sale
Apartments
Apartment
2 rooms
37 m2
1 outbuilding
2024-12-03
48 990 
875  /m²(56 m²)
Sale
Houses
House
2 rooms
56 m2
2024-11-21
261 500 
Sale
Land
429 m2
-Terrains à bâtir
2024-11-14
221 600 
2 518  /m²(88 m²)
Sale
Houses
House
5 rooms
88 m2
1 outbuilding
Land
597 m2
-Sols
2024-10-30
247 000 
1 739  /m²(142 m²)
Sale
Houses
House
5 rooms
142 m2
Land
750 m2
-Sols
2024-10-24
163 799 
1 260  /m²(130 m²)
Sale
Houses
House
5 rooms
130 m2
1 outbuilding
Land
719 m2
-Sols
2024-10-21
7 644 
Sale
Land
13650 m2
-Terres
2024-10-11
112 000 
2 800  /m²(40 m²)
Sale
Apartments
Apartment
2 rooms
40 m2
1 outbuilding
2024-10-01
57 000 
Sale
Land
414 m2
-Terrains à bâtir
308 transactions listed in the municipality

Ille-et-Vilaine (35)

Most expensive cities

City
name
Descending orderHouses
house
Price per m²
5 682 
5 538 
4 545 
4 504 
4 150 
4 118 
3 857 
3 721 
3 714 
City
name
Descending orderApartments
apt.
Price per m²
5 306 
5 061 
4 627 
4 194 
4 011 
3 914 
3 835 
3 755 

Least expensive cities

City
name
Ascending orderHouses
house
Price per m²
982 
1 041 
1 047 
1 111 
1 125 
1 128 
1 150 
City
name
Ascending orderApartments
apt.
Price per m²
238 
267 
315 
352