emooki
HomePrice mapTransactions
🇬🇧 English🇫🇷 Français🇩🇪 Deutsch🇪🇸 Español🇮🇹 Italiano

Real estate price map


Real estate price map in the municipality of Crevin, choose a section to see transactions by parcel.

Ille-et-Vilaine (35)

Crevin - Real estate price m²

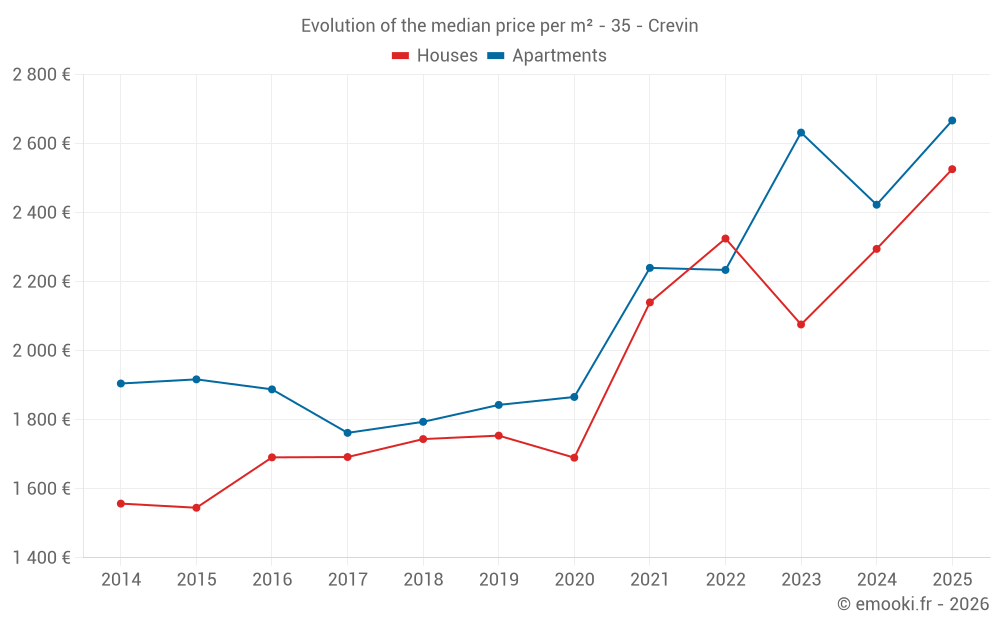
Median price of real estate
in the municipality of Crevin

HousesHouses
2 390  /m²
1-23-45-67-89-10
Reliability 8/10
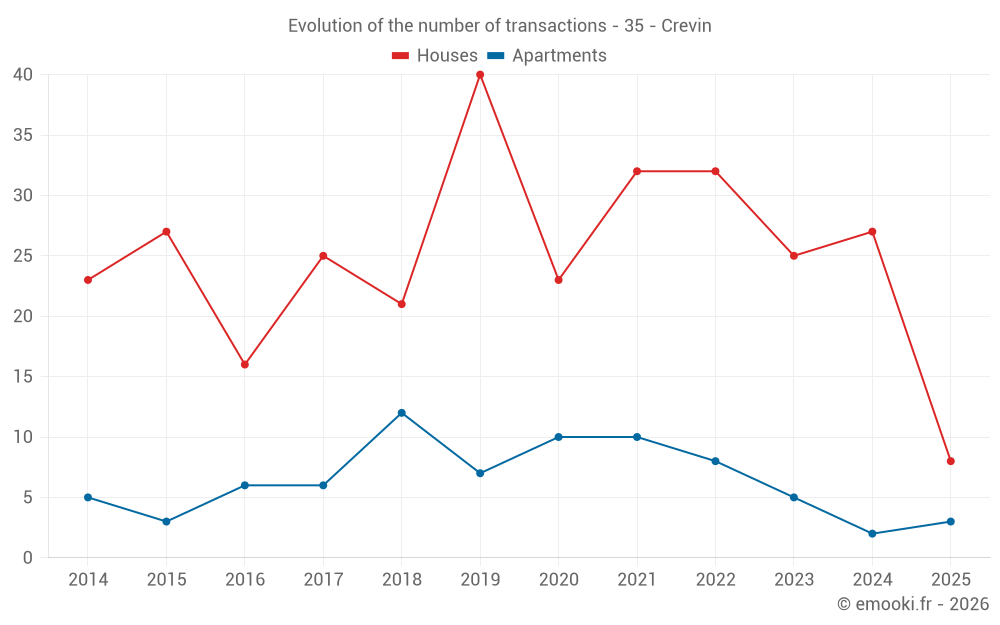
Median price on the 24 transactions of the last 12 months.
from 1 832 to
2 694  /m²
60% of transactions from the 2nd to the 8th deciles.
ApartmentsApartments
2 612  /m²
1-23-45-67-89-10
Reliability 6/10
Median price on the 15 transactions of the last 36 months.
from 2 167 to
2 690  /m²
60% of transactions from the 2nd to the 8th deciles.
DwellingsDwellings
2 478  /m²
1-23-45-67-89-10
Reliability 8/10
Median price on the 28 transactions of the last 12 months.
from 1 989 to
2 718  /m²
60% of transactions from the 2nd to the 8th deciles.
HousesEvolution of the price per m² of houses since...
1 year
+10%
2 years
+22%
3 years
+8.6%
4 years
+18%
5 years
+49%
6 years
+44%
7 years
+45%
8 years
+49%
9 years
+49%
10 years
+63%
11 years
+62%

Yearly evolution

Evolution of the median price per m²

Evolution of the median price per m² - 35 - Crevin

Evolution of the number of transactions

Warning, last year incomplete. Projections made based on the proportions between semesters of the previous year at the departmental/national level and by type of property.

Evolution of the number of transactions - 35 - Crevin

Yearly data

Descending order
Year
Houses
house
transactions
Houses
house
Price per m²
Apartments
apt.
transactions
Apartments
apt.
Price per m²
2025
8
2 526 
3
2 667 
2024
27
2 295 
2
2 423 
2023
25
2 076 
5
2 632 
2022
32
2 325 
8
2 234 
2021
32
2 140 
10
2 240 
2020
23
1 690 
10
1 866 
2019
40
1 754 
7
1 843 
2018
21
1 744 
12
1 794 
2017
25
1 692 
6
1 762 
2016
16
1 691 
6
1 888 
2015
27
1 545 
3
1 917 
2014
23
1 557 
5
1 905 

Analysis

Structure of prices per m²

Values of price percentiles per m² over the periods used for the estimated price of each type of property.

Structure of transaction amounts

Values of transaction amounts percentiles over the periods used for the estimated price of each type of property.

Transaction amounts and prices per m² by percentile

Ascending order
Percentile
Houses
house
Price per m²
Houses
house
Transaction amount
Apartments
apt.
Price per m²
Apartments
apt.
Transaction amount
10th percentile
977 
127 K
2 131 
114 K
20th percentile
1 832 
163 K
2 167 
128 K
30th percentile
2 188 
197 K
2 255 
144 K
40th percentile
2 304 
224 K
2 435 
155 K
50th percentile
2 390 
227 K
2 612 
160 K
60th percentile
2 478 
236 K
2 634 
163 K
70th percentile
2 548 
258 K
2 661 
167 K
80th percentile
2 694 
313 K
2 690 
172 K
90th percentile
2 842 
333 K
2 698 
175 K

National and departmental comparison

Evolution of the median price per m² of houses

Evolution of the median price per m² of apartments

Quarterly evolution

Evolution of the median price per m²

Evolution of the number of transactions

Quarterly data

Descending order
Quarter
Houses
house
transactions
Houses
house
Price per m²
Apartments
apt.
transactions
Apartments
apt.
Price per m²
2025 Q2
4
2 316 
0
--- 
2025 Q1
4
2 688 
3
2 667 
2024 Q4
10
2 250 
1
2 612 
2024 Q3
6
2 416 
0
--- 
2024 Q2
6
2 284 
0
--- 
2024 Q1
5
2 119 
1
2 234 
2023 Q4
4
2 502 
0
--- 
2023 Q3
5
2 375 
1
2 176 
2023 Q2
4
2 164 
3
2 632 
2023 Q1
12
2 020 
1
2 689 
2022 Q4
9
2 089 
1
2 338 
2022 Q3
9
2 673 
4
2 314 
2022 Q2
7
2 553 
0
--- 
2022 Q1
7
2 328 
3
2 102 
2021 Q4
8
1 960 
2
2 180 
2021 Q3
11
1 944 
3
2 417 
2021 Q2
7
2 313 
3
2 257 
2021 Q1
6
2 383 
2
2 182 
2020 Q4
5
1 986 
2
1 834 
2020 Q3
10
1 695 
1
1 776 
2020 Q2
5
1 505 
5
2 023 
2020 Q1
3
1 600 
2
1 887 
2019 Q4
12
1 828 
2
1 730 
2019 Q3
14
1 712 
3
1 843 
2019 Q2
8
1 816 
1
2 111 
2019 Q1
6
1 855 
1
1 889 
2018 Q4
8
1 543 
3
1 750 
2018 Q3
6
1 948 
4
2 008 
2018 Q2
5
1 656 
3
1 615 
2018 Q1
2
1 934 
2
1 876 
2017 Q4
8
1 642 
1
1 746 
2017 Q3
4
2 008 
2
1 910 
2017 Q2
12
1 604 
1
2 064 
2017 Q1
1
1 726 
2
1 762 
2016 Q4
7
1 834 
1
2 200 
2016 Q3
4
1 534 
2
1 882 
2016 Q2
2
1 100 
0
--- 
2016 Q1
3
1 721 
3
1 875 
2015 Q4
5
1 523 
0
--- 
2015 Q3
6
1 896 
2
1 932 
2015 Q2
10
1 651 
1
1 900 
2015 Q1
6
1 518 
0
--- 
2014 Q4
6
1 616 
2
1 824 
2014 Q3
6
1 600 
1
1 982 
2014 Q2
7
1 575 
0
--- 
2014 Q1
4
1 494 
2
1 959 

Overview of the latest real estate transactions

The following list is an anonymized overview of the latest transactions. For more details and to find all transactions, please use the map to view transactions by plot or the transaction search page for a search by criteria.

2025-06-26
134 000 
Sale
1 outbuilding
Land
989 m2
-Terrains à bâtir
2025-06-10
80 000 
Sale
Land
432 m2
-Terrains à bâtir
2025-06-05
250 000 
845  /m²(296 m²)
Sale
Commercial property
296 m2
Land
1100 m2
-Sols
2025-06-04
69 500 
Sale
Land
342 m2
-Terrains à bâtir
2025-06-04
4 735 
Sale
Land
5355 m2
-Terrains à bâtir
2025-05-27
213 500 
2 426  /m²(88 m²)
Sale
Houses
House
5 rooms
88 m2
Land
827 m2
-Sols
2025-05-27
71 000 
Sale
Land
347 m2
-Terrains à bâtir
2025-05-21
49 500 
Sale
Land
236 m2
-Terrains à bâtir
2025-04-22
113 000 
1 638  /m²(69 m²)
Sale
Houses
House
3 rooms
69 m2
Land
212 m2
-Sols
2025-04-17
1 
Sale
Land
511 m2
-Terres
2025-04-16
199 000 
3 210  /m²(62 m²)
Sale
Houses
House
3 rooms
62 m2
Land
563 m2
-Sols
2025-04-09
69 000 
Sale
Land
336 m2
-Terrains à bâtir
2025-04-09
76 000 
Sale
Land
373 m2
-Terrains à bâtir
2025-04-02
225 000 
2 206  /m²(102 m²)
Sale
Houses
House
4 rooms
102 m2
Land
700 m2
-Sols
2025-03-26
237 000 
714  /m²(332 m²)
Sale
Houses
House
6 rooms
256 m2
Houses
House
3 rooms
76 m2
1 outbuilding
2025-03-05
360 500 
2 752  /m²(131 m²)
Sale
Houses
House
5 rooms
131 m2
Land
496 m2
-Sols
2025-02-20
174 000 
2 636  /m²(66 m²)
Sale
Apartments
Apartment
3 rooms
66 m2
1 outbuilding
2025-02-20
15 000 
Sale
1 outbuilding
2025-02-14
231 000 
2 625  /m²(88 m²)
Sale
Houses
House
4 rooms
88 m2
Land
240 m2
-Sols
2025-02-13
305 000 
3 245  /m²(94 m²)
Sale
Houses
House
4 rooms
94 m2
2 outbuildings
Land
500 m2
-Jardins
/Jardin potager
Land
2387 m2
-Terrains d'agrément
Land
1400 m2
-Sols
713 transactions listed in the municipality

Ille-et-Vilaine (35)

Most expensive cities

City
name
Descending orderHouses
house
Price per m²
5 682 
5 538 
4 545 
4 504 
4 150 
4 118 
3 857 
3 721 
3 714 
City
name
Descending orderApartments
apt.
Price per m²
5 306 
5 061 
4 627 
4 194 
4 011 
3 914 
3 835 
3 755 

Least expensive cities

City
name
Ascending orderHouses
house
Price per m²
982 
1 041 
1 047 
1 111 
1 125 
1 128 
1 150 
City
name
Ascending orderApartments
apt.
Price per m²
238 
267 
315 
352