Real estate price map
Real estate price map in the municipality of Val-Couesnon, choose a section to see transactions by parcel.
Ille-et-Vilaine (35)
Price per m² in Val-Couesnon
Median price of real estate
in the municipality of Val-Couesnon
Houses
1 052 € /m²
Reliability 9/10
Median price on the 36 transactions of the last 6 months.
from 660 to
1 672 € /m²
1 672 € /m²
60% of transactions from the 2nd to the 8th deciles.
Apartments
1 234 € /m²
Reliability 4/10
Median price on the 8 transactions of the last 60 months.
Dwellings
1 052 € /m²
Reliability 9/10
Median price on the 36 transactions of the last 6 months.
from 660 to
1 672 € /m²
1 672 € /m²
60% of transactions from the 2nd to the 8th deciles.
Evolution of the price per m² of houses since...
1 year
-3.7%
2 years
+6.6%
3 years
-6.6%
4 years
+15%
5 years
+32%
6 years
+24%
7 years
+63%
8 years
+28%
9 years
+33%
10 years
+19%
11 years
+17%
The price per m² of houses has decreased by 6.6% since 3 years, but it has increased by 63% in 7 years.
1271 transactions listed in the municipality
Yearly data
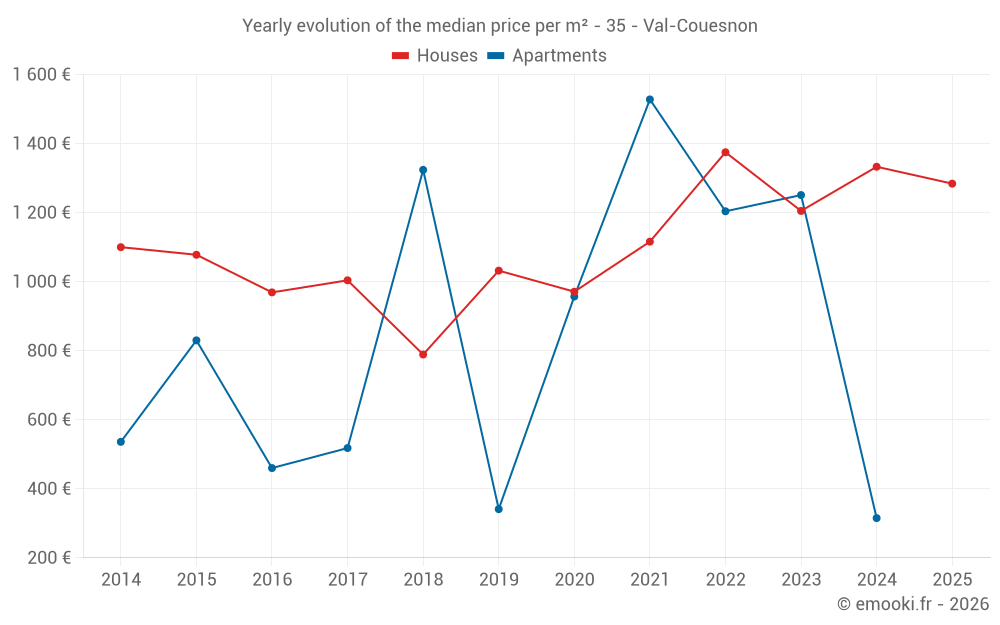
Yearly evolution of the median price per m²
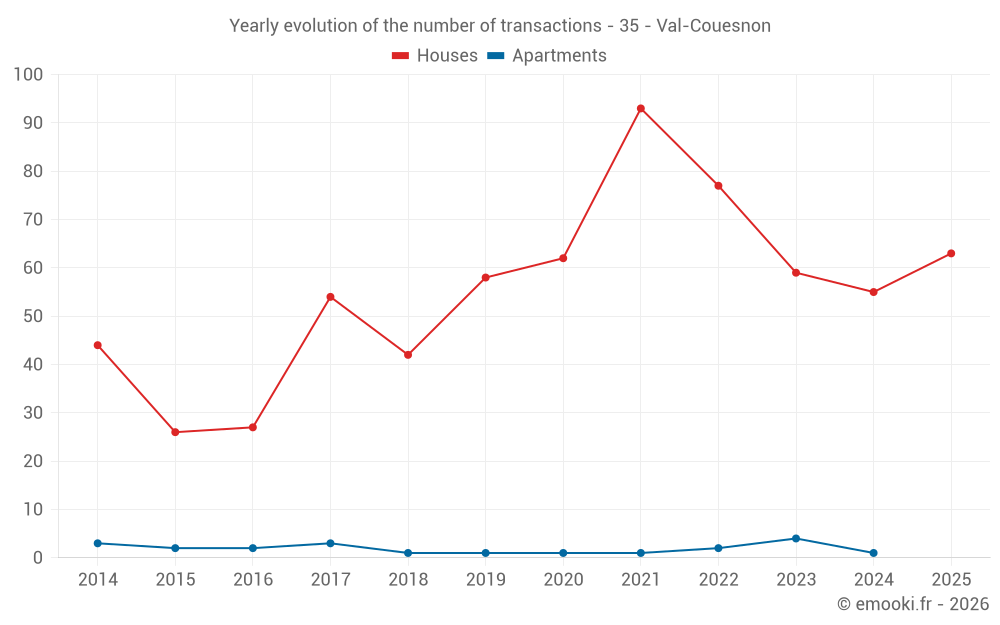
Yearly evolution of the number of transactions
Yearly table
Year
house
transactions
transactions
house
Price per m²
Price per m²
apt.
transactions
transactions
apt.
Price per m²
Price per m²
2025
63
1 284 €
0
--- €
2024
55
1 333 €
1
315 €
2023
59
1 205 €
4
1 251 €
2022
77
1 375 €
2
1 204 €
2021
93
1 116 €
1
1 528 €
2020
62
971 €
1
957 €
2019
58
1 032 €
1
341 €
2018
42
789 €
1
1 324 €
2017
54
1 004 €
3
518 €
2016
27
969 €
2
460 €
2015
26
1 078 €
2
830 €
2014
44
1 100 €
3
536 €
Analysis
Structure of prices per m²
Values of price percentiles per m² over the periods used for the estimated price of each type of property.
Structure of transaction amounts
Values of transaction amounts percentiles over the periods used for the estimated price of each type of property.
Transaction amounts and prices per m² by percentile
Percentile
house
Price per m²
Price per m²
house
Transaction amount
Transaction amount
apt.
Price per m²
Price per m²
apt.
Transaction amount
Transaction amount
10th percentile
518 €
32 500 €
570 €
40 645 €
20th percentile
660 €
47 000 €
852 €
51 267 €
30th percentile
838 €
72 500 €
1 115 €
52 300 €
40th percentile
887 €
95 000 €
1 157 €
54 400 €
50th percentile
1 052 €
107 K€
1 234 €
65 500 €
60th percentile
1 132 €
128 K€
1 307 €
76 800 €
70th percentile
1 482 €
150 K€
1 330 €
79 600 €
80th percentile
1 672 €
163 K€
1 450 €
151 K€
90th percentile
1 987 €
195 K€
1 574 €
220 K€
National and departmental comparison
Evolution of the median price per m² of houses
Evolution of the median price per m² of apartments
Quarterly data
Quarterly evolution of the median price per m²
Quarterly evolution of the number of transactions
Quarterly table
Quarter
house
transactions
transactions
house
Price per m²
Price per m²
apt.
transactions
transactions
apt.
Price per m²
Price per m²
2025 Q4
18
1 288 €
0
--- €
2025 Q3
18
864 €
0
--- €
2025 Q2
15
1 500 €
0
--- €
2025 Q1
12
1 572 €
0
--- €
2024 Q4
13
1 250 €
1
315 €
2024 Q3
18
1 294 €
0
--- €
2024 Q2
15
929 €
0
--- €
2024 Q1
9
2 000 €
0
--- €
2023 Q4
13
1 138 €
0
--- €
2023 Q3
12
1 274 €
1
680 €
2023 Q2
19
869 €
1
1 682 €
2023 Q1
15
1 205 €
2
1 251 €
2022 Q4
20
1 434 €
0
--- €
2022 Q3
17
1 450 €
2
1 204 €
2022 Q2
22
1 190 €
0
--- €
2022 Q1
18
1 209 €
0
--- €
2021 Q4
23
1 059 €
1
1 528 €
2021 Q3
23
1 116 €
0
--- €
2021 Q2
32
1 117 €
0
--- €
2021 Q1
15
1 179 €
0
--- €
2020 Q4
23
1 197 €
1
957 €
2020 Q3
14
748 €
0
--- €
2020 Q2
16
1 156 €
0
--- €
2020 Q1
9
854 €
0
--- €
2019 Q4
21
1 081 €
0
--- €
2019 Q3
13
1 032 €
0
--- €
2019 Q2
11
1 032 €
1
341 €
2019 Q1
13
942 €
0
--- €
2018 Q4
8
754 €
1
1 324 €
2018 Q3
10
1 022 €
0
--- €
2018 Q2
18
794 €
0
--- €
2018 Q1
6
504 €
0
--- €
2017 Q4
13
1 008 €
0
--- €
2017 Q3
17
976 €
0
--- €
2017 Q2
14
1 315 €
2
583 €
2017 Q1
10
934 €
1
518 €
2016 Q4
5
958 €
0
--- €
2016 Q3
9
969 €
0
--- €
2016 Q2
11
909 €
1
578 €
2016 Q1
2
1 298 €
1
341 €
2015 Q4
11
670 €
2
830 €
2015 Q3
5
976 €
0
--- €
2015 Q2
9
1 289 €
0
--- €
2015 Q1
1
959 €
0
--- €
2014 Q4
13
1 098 €
1
536 €
2014 Q3
12
1 126 €
1
239 €
2014 Q2
14
982 €
0
--- €
2014 Q1
5
1 306 €
1
667 €
Key takeaways
What is the price per m2 of houses in Val-Couesnon?
The median price on the 36 house transactions of the last 6 months in the municipality of Val-Couesnon was 1 052 € per square meter for a median property value of 106 500 €. Over this period, 60% of transactions were between 660 and 1 672 € per square meter (from the 2nd to the 8th deciles).
Compare with neighboring municipalities
City
name
name
house
Price per m²
Price per m²
apt.
Price per m²
Price per m²
City information
Zip codes
- ST OUEN LA ROUERIE 35460 VAL COUESNON
- TREMBLAY 35460 VAL COUESNON
- ANTRAIN 35560 VAL COUESNON
- LA FONTENELLE 35560 VAL COUESNON