emooki
SearchPrice mapTransactions
🇬🇧 English🇫🇷 Français🇩🇪 Deutsch🇪🇸 Español🇮🇹 Italiano

Real estate price map


Real estate price map in the municipality of Montagnac.

Hérault (34)
Montagnac

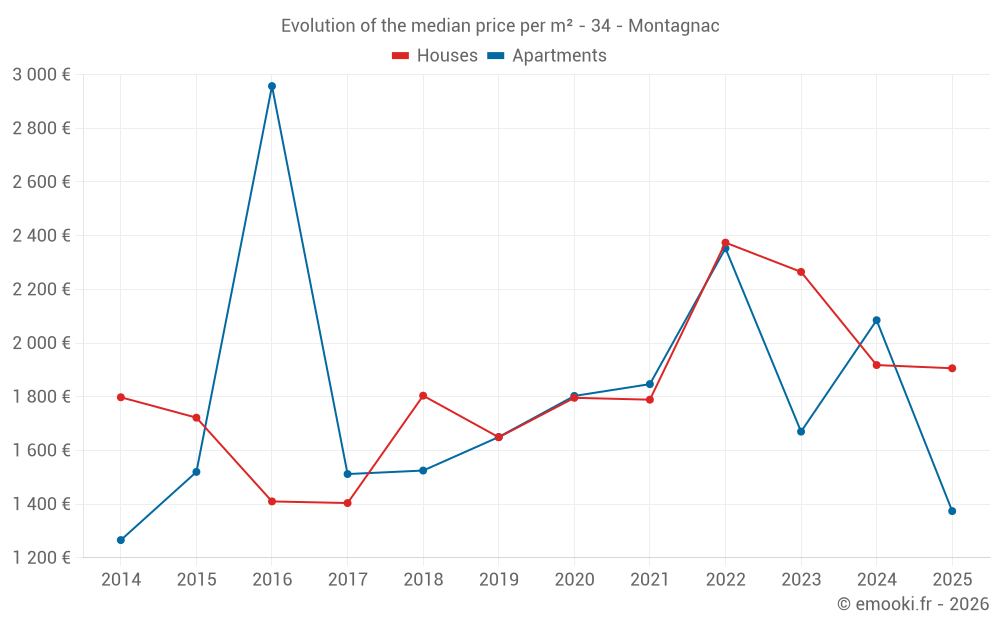
Median price of real estate
in the municipality of Montagnac

HousesHouses
1 820 € /m²
1-23-45-67-89-10
Reliability 8/10
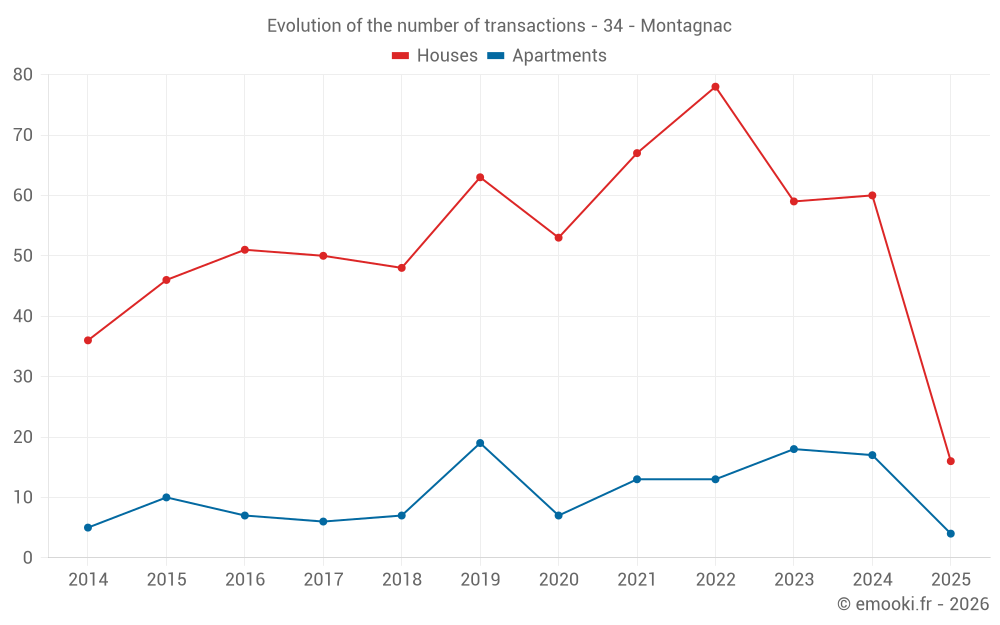
Median price on the 47 transactions of the last 12 months.
from 1 331 to
2 363 € /m²
60% of transactions from the 2nd to the 8th deciles.
ApartmentsApartments
1 734 € /m²
1-23-45-67-89-10
Reliability 7/10
Median price on the 30 transactions of the last 24 months.
from 1 157 to
2 976 € /m²
60% of transactions from the 2nd to the 8th deciles.
DwellingsDwellings
1 766 € /m²
1-23-45-67-89-10
Reliability 9/10
Median price on the 20 transactions of the last 6 months.
from 1 185 to
2 341 € /m²
60% of transactions from the 2nd to the 8th deciles.
HousesEvolution of the price per m² of houses
1 year
-0.6%
2 years
-15.8%
3 years
-19.7%
4 years
+6.5%
5 years
+6.1%
6 years
+15.6%
7 years
+5.7%
8 years
+35.8%
9 years
+35.2%
10 years
+10.7%
11 years
+6%
ApartmentsEvolution of the price per m² of apartments
1 year
--
2 years
--
3 years
--
4 years
--
5 years
--
6 years
--
7 years
--
8 years
--
9 years
--
10 years
--
11 years
--

Yearly evolution

Median price per m²

Number of transactions

Warning, last year incomplete. Projections made based on the proportions between semesters of the previous year at the departmental/national level and by type of property.

Yearly data

Descending order
Year
Houses
house
Price per m²
Houses
house
transactions
Apartments
apt.
Price per m²
Apartments
apt.
transactions
2025
1 906 €
16
1 374 €
4
2024
1 918 €
60
2 085 €
17
2023
2 265 €
59
1 670 €
18
2022
2 374 €
78
2 353 €
13
2021
1 789 €
67
1 847 €
13
2020
1 796 €
53
1 803 €
7
2019
1 649 €
63
1 650 €
19
2018
1 804 €
48
1 525 €
7
2017
1 404 €
50
1 512 €
6
2016
1 410 €
51
2 957 €
7
2015
1 722 €
46
1 520 €
10
2014
1 798 €
36
1 266 €
5

Quarterly evolution

Median price per m²

Number of transactions

Analysis

Structure of prices per m²

Values of price percentiles per m² over the periods used for the estimated price of each type of property.

Hérault (34)

Most expensive cities

City
name
Descending orderHouses
house
Price per m²
6 604 €
6 267 €
4 826 €
4 686 €
4 587 €
4 550 €
4 500 €
4 436 €
4 422 €
4 418 €
City
name
Descending orderApartments
apt.
Price per m²
5 318 €
5 204 €
4 953 €
4 917 €
4 496 €
4 294 €
4 238 €
4 214 €
4 145 €

Least expensive cities

City
name
Ascending orderHouses
house
Price per m²
426 €
684 €
848 €
894 €
974 €
1 006 €
1 008 €
City
name
Ascending orderApartments
apt.
Price per m²
267 €
302 €
308 €
337 €
338 €
347 €
448 €
454 €
481 €