emooki
SearchPrice mapTransactions
EnglishFrançaisDeutschEspañolItaliano

Real estate price map


Real estate price map in the municipality of Saint-Pons-de-Mauchiens.

Hérault (34)
Saint-Pons-de-Mauchiens

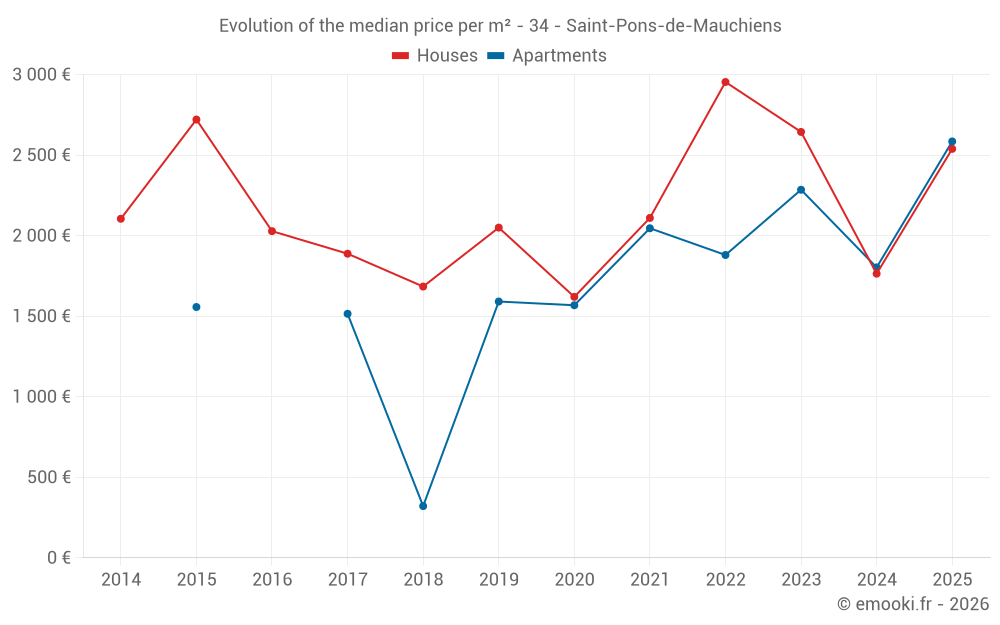
Median price of real estate
in the municipality of Saint-Pons-de-Mauchiens

HousesHouses
2 446 € /m²
1-23-45-67-89-10
Reliability 7/10
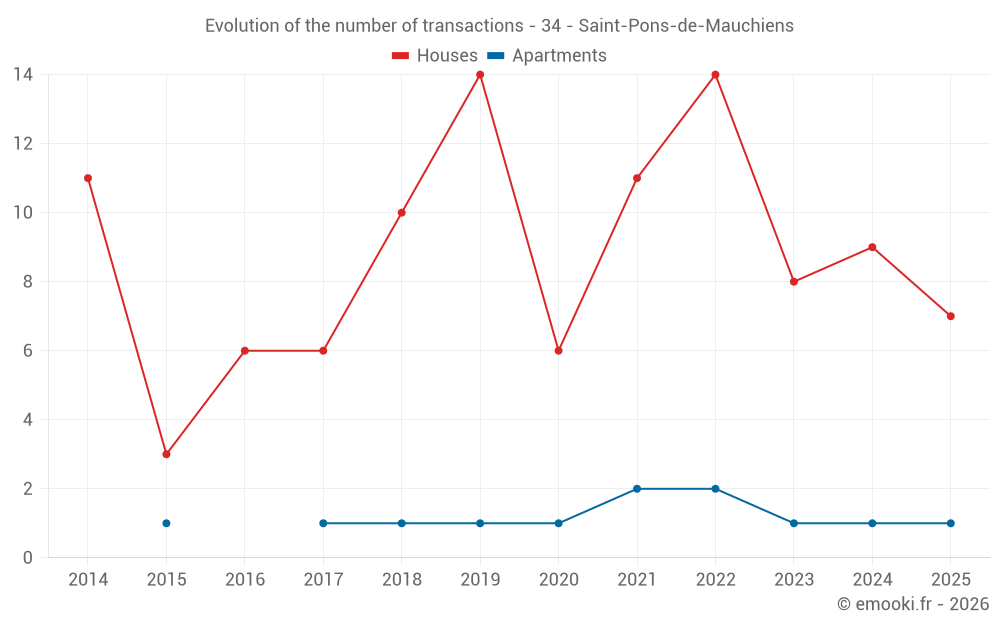
Median price on the 20 transactions of the last 24 months.
from 1 680 to
3 577 € /m²
60% of transactions from the 2nd to the 8th deciles.
ApartmentsApartments
2 046 € /m²
1-23-45-67-89-10
Reliability 4/10
Median price on the 8 transactions of the last 60 months.
DwellingsDwellings
2 354 € /m²
1-23-45-67-89-10
Reliability 7/10
Median price on the 23 transactions of the last 24 months.
from 1 721 to
3 399 € /m²
60% of transactions from the 2nd to the 8th deciles.
HousesEvolution of the price per m² of houses
1 year
+43.9%
2 years
-4%
3 years
-14%
4 years
+20.3%
5 years
+56.7%
6 years
+23.9%
7 years
+50.8%
8 years
+34.5%
9 years
+25.2%
10 years
--
11 years
+20.6%
ApartmentsEvolution of the price per m² of apartments
1 year
--
2 years
--
3 years
--
4 years
--
5 years
--
6 years
--
7 years
--
8 years
--
9 years
--
10 years
--
11 years
--

Yearly evolution

Median price per m²

Number of transactions

Warning, last year incomplete. Projections made based on the proportions between semesters of the previous year at the departmental/national level and by type of property.

Yearly data

Descending order
Year
Houses
house
Price per m²
Houses
house
transactions
Apartments
apt.
Price per m²
Apartments
apt.
transactions
2025
2 539 €
7
2 585 €
1
2024
1 764 €
9
1 803 €
1
2023
2 644 €
8
2 285 €
1
2022
2 954 €
14
1 880 €
2
2021
2 110 €
11
2 046 €
2
2020
1 620 €
6
1 568 €
1
2019
2 050 €
14
1 591 €
1
2018
1 684 €
10
321 €
1
2017
1 888 €
6
1 515 €
1
2016
2 028 €
6
--- €
0
2015
2 721 €
3
1 557 €
1
2014
2 105 €
11
--- €
0

Quarterly evolution

Median price per m²

Number of transactions

Analysis

Structure of prices per m²

Values of price percentiles per m² over the periods used for the estimated price of each type of property.

Hérault (34)

Most expensive cities

City
name
Descending orderHouses
house
Price per m²
6 604 €
6 267 €
4 826 €
4 550 €
4 500 €
4 436 €
4 422 €
4 418 €
City
name
Descending orderApartments
apt.
Price per m²
5 318 €
4 953 €
4 917 €
4 496 €
4 294 €
4 214 €
4 145 €

Least expensive cities

City
name
Ascending orderHouses
house
Price per m²
426 €
684 €
848 €
1 008 €
City
name
Ascending orderApartments
apt.
Price per m²
267 €
302 €
308 €
337 €
338 €
448 €
454 €
481 €
emooki
Real estate statistics based on property value requests (DVF)
Need a specific analysis or dashboards, contact us