emooki
HomePrice mapTransactions
🇬🇧 English🇫🇷 Français🇩🇪 Deutsch🇪🇸 Español🇮🇹 Italiano

Real estate price map


Real estate price map in the municipality of Magalas, choose a section to see transactions by parcel.

Hérault (34)

Magalas - Real estate price m²

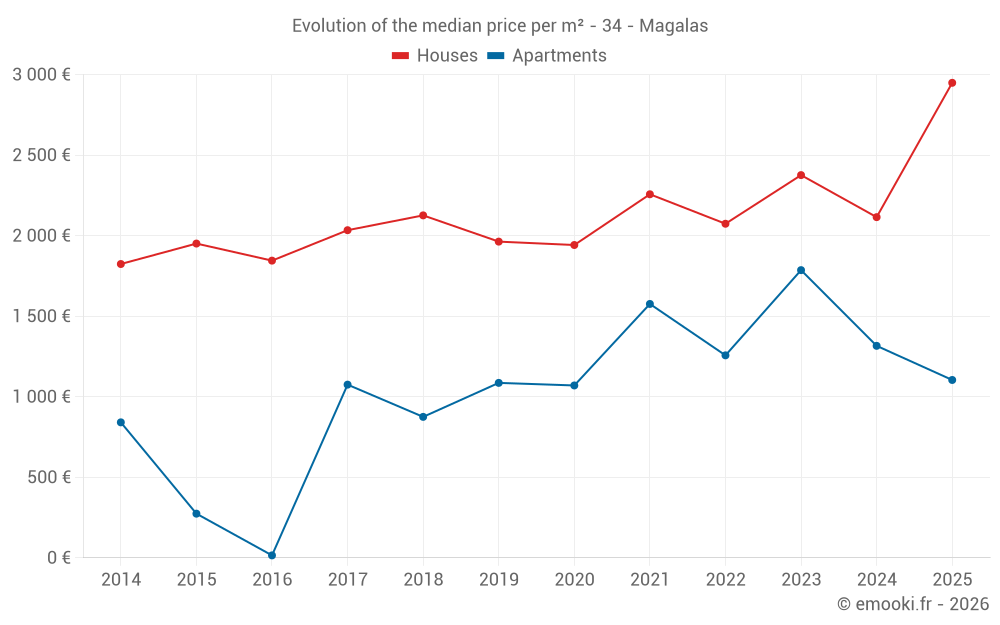
Median price of real estate
in the municipality of Magalas

HousesHouses
2 484  /m²
1-23-45-67-89-10
Reliability 8/10
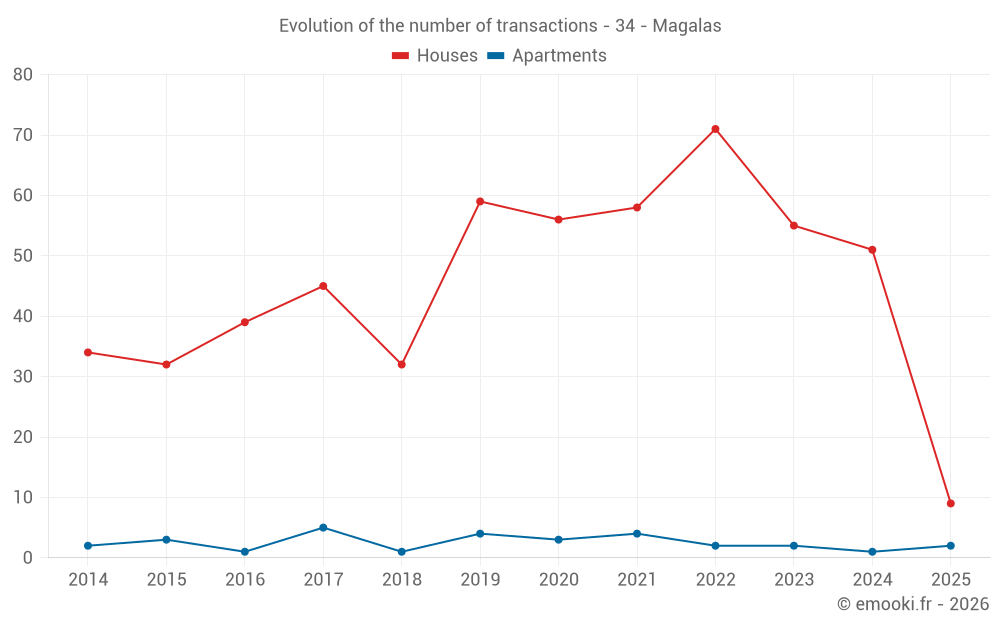
Median price on the 32 transactions of the last 12 months.
from 1 270 to
3 207  /m²
60% of transactions from the 2nd to the 8th deciles.
ApartmentsApartments
1 330  /m²
1-23-45-67-89-10
Reliability 4/10
Median price on the 12 transactions of the last 60 months.
from 1 034 to
1 753  /m²
60% of transactions from the 2nd to the 8th deciles.
DwellingsDwellings
2 437  /m²
1-23-45-67-89-10
Reliability 8/10
Median price on the 34 transactions of the last 12 months.
from 1 220 to
3 196  /m²
60% of transactions from the 2nd to the 8th deciles.
HousesEvolution of the price per m² of houses since...
1 year
+39%
2 years
+24%
3 years
+42%
4 years
+31%
5 years
+52%
6 years
+50%
7 years
+39%
8 years
+45%
9 years
+60%
10 years
+51%
11 years
+62%

Yearly evolution

Evolution of the median price per m²

Evolution of the median price per m² - 34 - Magalas

Evolution of the number of transactions

Warning, last year incomplete. Projections made based on the proportions between semesters of the previous year at the departmental/national level and by type of property.

Evolution of the number of transactions - 34 - Magalas

Yearly data

Descending order
Year
Houses
house
transactions
Houses
house
Price per m²
Apartments
apt.
transactions
Apartments
apt.
Price per m²
2025
9
2 949 
2
1 104 
2024
51
2 115 
1
1 316 
2023
55
2 376 
2
1 786 
2022
71
2 074 
2
1 257 
2021
58
2 257 
4
1 576 
2020
56
1 942 
3
1 070 
2019
59
1 963 
4
1 086 
2018
32
2 126 
1
875 
2017
45
2 034 
5
1 075 
2016
39
1 845 
1
15 
2015
32
1 951 
3
274 
2014
34
1 824 
2
841 

Analysis

Structure of prices per m²

Values of price percentiles per m² over the periods used for the estimated price of each type of property.

Structure of transaction amounts

Values of transaction amounts percentiles over the periods used for the estimated price of each type of property.

Transaction amounts and prices per m² by percentile

Ascending order
Percentile
Houses
house
Price per m²
Houses
house
Transaction amount
Apartments
apt.
Price per m²
Apartments
apt.
Transaction amount
10th percentile
1 165 
75 595 
709 
50 640 
20th percentile
1 270 
81 052 
1 034 
56 720 
30th percentile
1 894 
111 K
1 099 
64 600 
40th percentile
2 111 
223 K
1 227 
80 000 
50th percentile
2 484 
246 K
1 330 
90 500 
60th percentile
2 729 
260 K
1 431 
108 K
70th percentile
2 942 
283 K
1 520 
128 K
80th percentile
3 207 
303 K
1 753 
148 K
90th percentile
3 389 
372 K
1 895 
258 K

National and departmental comparison

Evolution of the median price per m² of houses

Evolution of the median price per m² of apartments

Quarterly evolution

Evolution of the median price per m²

Evolution of the number of transactions

Quarterly data

Descending order
Quarter
Houses
house
transactions
Houses
house
Price per m²
Apartments
apt.
transactions
Apartments
apt.
Price per m²
2025 Q2
4
2 424 
0
--- 
2025 Q1
5
3 072 
2
1 104 
2024 Q4
10
2 484 
0
--- 
2024 Q3
13
2 215 
0
--- 
2024 Q2
12
2 402 
0
--- 
2024 Q1
16
1 958 
1
1 316 
2023 Q4
12
2 482 
1
2 405 
2023 Q3
13
2 379 
0
--- 
2023 Q2
15
2 045 
1
1 167 
2023 Q1
15
2 576 
0
--- 
2022 Q4
16
2 072 
1
1 489 
2022 Q3
18
2 146 
0
--- 
2022 Q2
21
2 188 
1
1 025 
2022 Q1
16
1 294 
0
--- 
2021 Q4
13
2 529 
0
--- 
2021 Q3
13
2 034 
2
916 
2021 Q2
13
2 258 
2
1 856 
2021 Q1
19
2 097 
0
--- 
2020 Q4
16
2 008 
1
1 070 
2020 Q3
11
1 250 
0
--- 
2020 Q2
16
1 890 
1
571 
2020 Q1
13
2 102 
1
1 333 
2019 Q4
16
1 910 
0
--- 
2019 Q3
16
1 989 
1
1 421 
2019 Q2
15
1 973 
2
552 
2019 Q1
12
1 716 
1
1 455 
2018 Q4
7
2 193 
1
875 
2018 Q3
11
2 093 
0
--- 
2018 Q2
11
2 277 
0
--- 
2018 Q1
3
1 745 
0
--- 
2017 Q4
8
2 224 
0
--- 
2017 Q3
9
2 043 
0
--- 
2017 Q2
14
1 823 
3
758 
2017 Q1
14
2 007 
2
1 261 
2016 Q4
10
2 198 
0
--- 
2016 Q3
14
1 816 
1
15 
2016 Q2
6
1 792 
0
--- 
2016 Q1
9
1 618 
0
--- 
2015 Q4
6
2 392 
0
--- 
2015 Q3
10
2 042 
2
214 
2015 Q2
10
1 744 
1
1 133 
2015 Q1
6
1 962 
0
--- 
2014 Q4
8
1 381 
1
1 182 
2014 Q3
10
1 556 
1
500 
2014 Q2
8
1 994 
0
--- 
2014 Q1
8
2 067 
0
--- 

Overview of the latest real estate transactions

The following list is an anonymized overview of the latest transactions. For more details and to find all transactions, please use the map to view transactions by plot or the transaction search page for a search by criteria.

2025-05-26
286 500 
3 494  /m²(82 m²)
Sale
Houses
House
4 rooms
82 m2
2 outbuildings
Land
479 m2
-Sols
2025-05-22
80 000 
Sale
Land
8090 m2
-Vignes
Land
14532 m2
-Vignes
Land
14533 m2
-Vignes
Land
25 m2
-Sols
Land
960 m2
-Taillis simples
Land
2060 m2
-Terres
Land
6480 m2
-Vignes
Land
10850 m2
-Vignes
Land
7492 m2
-Vignes
Land
16 m2
-Sols
2025-05-19
150 000 
Sale
Land
29455 m2
-Vignes
Land
23492 m2
-Vignes
Land
15800 m2
-Vignes
Land
21733 m2
-Terres
Land
9590 m2
-Vignes
Land
97 m2
-Vignes
Land
1430 m2
-Vignes
Land
10980 m2
-Terres
Land
12 m2
-Sols
Land
11870 m2
-Vignes
Land
35 m2
-Sols
2025-05-14
5 700 
Exchange
Land
4940 m2
-Vignes
Land
6450 m2
-Vignes
2025-05-13
8 000 
Sale
Land
8210 m2
-Vignes
2025-05-06
1 000 
Sale
Land
660 m2
-Landes
Land
1260 m2
-Futaies résineuses
/Pins
2025-04-30
100 000 
Sale
Land
1816 m2
-Terrains à bâtir
2025-04-29
78 000 
1 219  /m²(64 m²)
Sale
Houses
House
2 rooms
64 m2
Land
97 m2
-Sols
2025-04-25
76 000 
1 900  /m²(40 m²)
Sale
Houses
House
3 rooms
40 m2
Land
55 m2
-Sols
2025-04-23
100 000 
Sale
Land
1780 m2
-Terrains à bâtir
2025-04-14
290 000 
659  /m²(440 m²)
1 487  /m²(195 m²)
Sale
Apartments
Apartment
2 rooms
40 m2
Apartments
Apartment
3 rooms
64 m2
1 outbuilding
Apartments
Apartment
4 rooms
91 m2
Commercial property
200 m2
Commercial property
45 m2
Land
861 m2
-Sols
2025-04-14
17 000 
Sale
Land
17080 m2
-Vignes
2025-04-10
185 000 
Sale
Land
97 m2
-Sols
Land
41 m2
-Sols
Land
119 m2
-Terrains à bâtir
Land
98 m2
-Sols
Land
963 m2
-Sols
Land
182 m2
-Sols
Land
38 m2
-Landes
Land
426 m2
-Vignes
2025-04-04
286 090 
2 949  /m²(97 m²)
Sale
Houses
House
5 rooms
97 m2
1 outbuilding
Land
615 m2
-Sols
2025-03-31
230 000 
2 473  /m²(93 m²)
Sale
Houses
House
4 rooms
93 m2
Land
513 m2
-Sols
2025-03-31
355 000 
957  /m²(371 m²)
3 698  /m²(96 m²)
Sale
Houses
House
3 rooms
96 m2
Commercial property
275 m2
Land
1204 m2
-Sols
2025-03-27
244 900 
2 401  /m²(102 m²)
Sale
Houses
House
4 rooms
102 m2
1 outbuilding
Land
552 m2
-Sols
2025-03-27
277 000 
Sale
Land
300 m2
-Terrains à bâtir
2025-03-26
1 000 
Sale
Land
2756 m2
-Terrains à bâtir
/Rue
Land
2336 m2
-Terrains à bâtir
/Rue
Land
995 m2
-Terrains à bâtir
/Rue
2025-03-21
307 200 
3 072  /m²(100 m²)
Sale
Houses
House
4 rooms
100 m2
1 outbuilding
Land
602 m2
-Sols
1132 transactions listed in the municipality

Hérault (34)

Most expensive cities

City
name
Descending orderHouses
house
Price per m²
6 604 
6 267 
4 826 
4 550 
4 500 
4 436 
4 422 
4 418 
City
name
Descending orderApartments
apt.
Price per m²
5 318 
4 953 
4 917 
4 496 
4 294 
4 214 
4 145 

Least expensive cities

City
name
Ascending orderHouses
house
Price per m²
426 
684 
848 
1 008 
City
name
Ascending orderApartments
apt.
Price per m²
267 
302 
308 
337 
338 
448 
454 
481