emooki
HomePrice mapTransactions
🇬🇧 English🇫🇷 Français🇩🇪 Deutsch🇪🇸 Español🇮🇹 Italiano

Real estate price map


Real estate price map in the municipality of Toulouse, choose a section to see transactions by parcel.

Haute-Garonne (31)

Toulouse - Real estate price m²

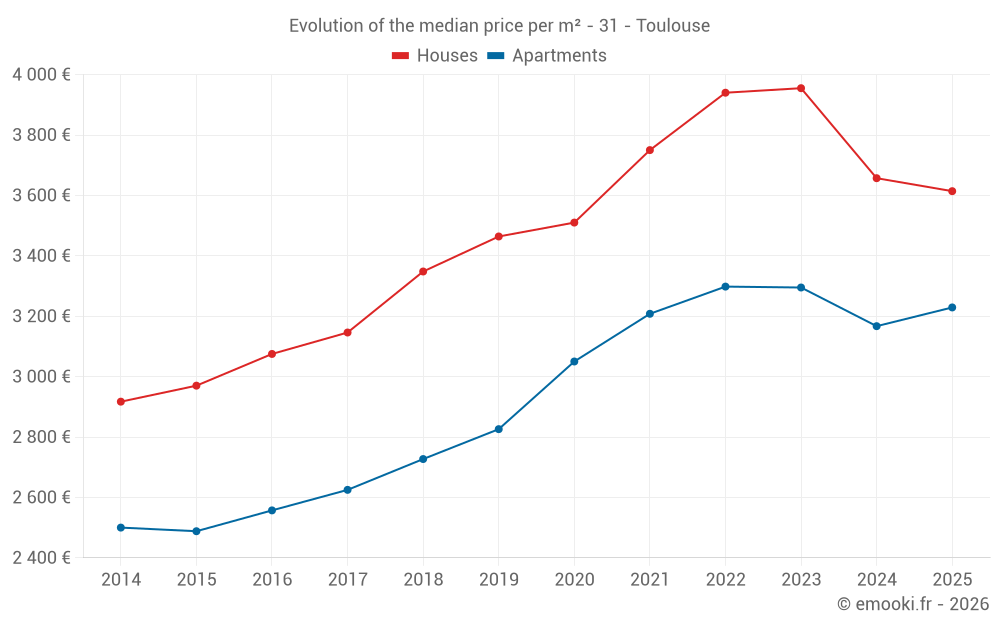
Median price of real estate
in the municipality of Toulouse

HousesHouses
3 571  /m²
1-23-45-67-89-10
Reliability 10/10
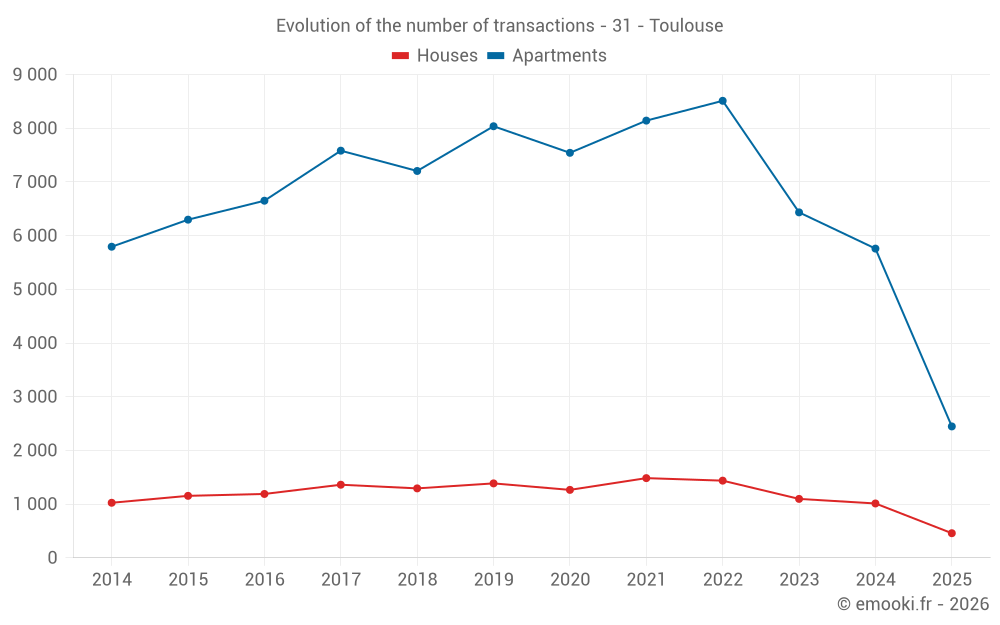
Median price on the 145 transactions of the last 3 months.
from 2 594 to
4 976  /m²
60% of transactions from the 2nd to the 8th deciles.
ApartmentsApartments
3 215  /m²
1-23-45-67-89-10
Reliability 10/10
Median price on the 814 transactions of the last 3 months.
from 2 288 to
4 395  /m²
60% of transactions from the 2nd to the 8th deciles.
DwellingsDwellings
3 262  /m²
1-23-45-67-89-10
Reliability 10/10
Median price on the 959 transactions of the last 3 months.
from 2 318 to
4 558  /m²
60% of transactions from the 2nd to the 8th deciles.
HousesEvolution of the price per m² of houses since...
1 year
-1.2%
2 years
-8.6%
3 years
-8.3%
4 years
-3.6%
5 years
+3%
6 years
+4.3%
7 years
+7.9%
8 years
+15%
9 years
+18%
10 years
+22%
11 years
+24%
The price per m² of houses has decreased by 8.6% since 2 years, but it has increased by 24% in 11 years.
ApartmentsEvolution of the price per m² of apartments since...
1 year
+2%
2 years
-2%
3 years
-2.1%
4 years
+0.7%
5 years
+5.9%
6 years
+14%
7 years
+18%
8 years
+23%
9 years
+26%
10 years
+30%
11 years
+29%
The price per m² of apartments has decreased by 2.1% since 3 years, but it has increased by 30% in 10 years.

Yearly evolution

Evolution of the median price per m²

Evolution of the median price per m² - 31 - Toulouse

Evolution of the number of transactions

Warning, last year incomplete. Projections made based on the proportions between semesters of the previous year at the departmental/national level and by type of property.

Evolution of the number of transactions - 31 - Toulouse

Yearly data

Descending order
Year
Houses
house
transactions
Houses
house
Price per m²
Apartments
apt.
transactions
Apartments
apt.
Price per m²
2025
458
3 614 
2 447
3 229 
2024
1 012
3 657 
5 759
3 167 
2023
1 097
3 955 
6 434
3 295 
2022
1 437
3 940 
8 512
3 298 
2021
1 484
3 750 
8 143
3 208 
2020
1 265
3 510 
7 543
3 050 
2019
1 386
3 464 
8 038
2 826 
2018
1 293
3 348 
7 205
2 727 
2017
1 361
3 146 
7 583
2 625 
2016
1 189
3 075 
6 651
2 557 
2015
1 154
2 970 
6 298
2 488 
2014
1 025
2 917 
5 794
2 500 

Analysis

Structure of prices per m²

Values of price percentiles per m² over the periods used for the estimated price of each type of property.

Structure of transaction amounts

Values of transaction amounts percentiles over the periods used for the estimated price of each type of property.

Transaction amounts and prices per m² by percentile

Ascending order
Percentile
Houses
house
Price per m²
Houses
house
Transaction amount
Apartments
apt.
Price per m²
Apartments
apt.
Transaction amount
10th percentile
2 130 
191 K
1 778 
79 120 
20th percentile
2 594 
234 K
2 288 
94 128 
30th percentile
2 831 
257 K
2 633 
107 K
40th percentile
3 206 
312 K
2 931 
122 K
50th percentile
3 571 
350 K
3 215 
137 K
60th percentile
4 180 
409 K
3 514 
157 K
70th percentile
4 439 
467 K
3 897 
185 K
80th percentile
4 976 
539 K
4 395 
236 K
90th percentile
5 683 
693 K
5 238 
329 K

National and departmental comparison

Evolution of the median price per m² of houses

Evolution of the median price per m² of apartments

Quarterly evolution

Evolution of the median price per m²

Evolution of the number of transactions

Quarterly data

Descending order
Quarter
Houses
house
transactions
Houses
house
Price per m²
Apartments
apt.
transactions
Apartments
apt.
Price per m²
2025 Q2
145
3 571 
814
3 215 
2025 Q1
313
3 615 
1 633
3 233 
2024 Q4
277
3 826 
1 495
3 100 
2024 Q3
318
3 616 
1 668
3 242 
2024 Q2
232
3 587 
1 394
3 152 
2024 Q1
185
3 673 
1 202
3 182 
2023 Q4
248
3 778 
1 373
3 238 
2023 Q3
323
4 015 
1 628
3 353 
2023 Q2
264
4 039 
1 748
3 268 
2023 Q1
262
3 942 
1 685
3 284 
2022 Q4
325
4 132 
1 877
3 340 
2022 Q3
416
3 945 
2 377
3 368 
2022 Q2
375
3 770 
2 260
3 266 
2022 Q1
321
3 942 
1 998
3 235 
2021 Q4
335
3 815 
1 975
3 231 
2021 Q3
460
3 682 
2 357
3 227 
2021 Q2
374
3 820 
2 089
3 250 
2021 Q1
315
3 658 
1 722
3 136 
2020 Q4
404
3 654 
2 075
3 114 
2020 Q3
300
3 510 
1 815
3 077 
2020 Q2
262
3 420 
1 790
3 050 
2020 Q1
299
3 378 
1 863
2 925 
2019 Q4
358
3 560 
2 162
2 868 
2019 Q3
384
3 588 
2 126
2 884 
2019 Q2
336
3 386 
1 928
2 782 
2019 Q1
308
3 338 
1 822
2 762 
2018 Q4
318
3 527 
1 911
2 783 
2018 Q3
390
3 331 
2 001
2 771 
2018 Q2
294
3 302 
1 664
2 693 
2018 Q1
291
3 167 
1 629
2 644 
2017 Q4
327
3 328 
1 785
2 650 
2017 Q3
379
3 077 
1 958
2 660 
2017 Q2
345
3 099 
1 939
2 617 
2017 Q1
310
3 092 
1 901
2 593 
2016 Q4
284
3 068 
1 751
2 607 
2016 Q3
381
3 108 
1 876
2 580 
2016 Q2
275
3 026 
1 611
2 531 
2016 Q1
249
3 128 
1 413
2 530 
2015 Q4
305
2 837 
1 621
2 524 
2015 Q3
334
3 114 
1 827
2 500 
2015 Q2
282
2 976 
1 533
2 451 
2015 Q1
233
2 920 
1 317
2 478 
2014 Q4
238
2 808 
1 330
2 564 
2014 Q3
333
3 013 
1 618
2 532 
2014 Q2
205
2 865 
1 387
2 437 
2014 Q1
249
2 865 
1 459
2 449 

Overview of the latest real estate transactions

The following list is an anonymized overview of the latest transactions. For more details and to find all transactions, please use the map to view transactions by plot or the transaction search page for a search by criteria.

2025-06-30
147 400 
2 948  /m²(50 m²)
Sale
Apartments
Apartment
3 rooms
50 m2
2 outbuildings
2025-06-30
908 703 
4 966  /m²(183 m²)
13 768  /m²(66 m²)
Sale
Land
1859 m2
-Terres
Land
47 m2
-Sols
Houses
House
3 rooms
66 m2
Commercial property
117 m2
Land
309 m2
-Sols
Land
207 m2
-Sols
Land
8 m2
-Sols
2025-06-30
290 950 
4 156  /m²(70 m²)
Sale
Apartments
Apartment
3 rooms
70 m2
1 outbuilding
2025-06-30
80 000 
1 818  /m²(44 m²)
Sale
Commercial property
12 m2
Commercial property
32 m2
2025-06-30
268 000 
2 233  /m²(120 m²)
Sale
Houses
House
4 rooms
120 m2
Land
294 m2
-Sols
2025-06-30
53 000 
2 944  /m²(18 m²)
Sale
Apartments
Apartment
1 room
18 m2
2025-06-30
640 000 
Sale
2025-06-30
81 000 
4 050  /m²(20 m²)
Sale
Apartments
Apartment
1 room
20 m2
2025-06-30
108 000 
2 919  /m²(37 m²)
Sale
Apartments
Apartment
2 rooms
37 m2
2 outbuildings
2025-06-30
479 680 
4 945  /m²(97 m²)
Sale
Apartments
Apartment
4 rooms
97 m2
1 outbuilding
2025-06-30
107 600 
2 445  /m²(44 m²)
Sale
Apartments
Apartment
2 rooms
44 m2
1 outbuilding
2025-06-30
153 000 
2 318  /m²(66 m²)
Sale
Apartments
Apartment
3 rooms
66 m2
2 outbuildings
2025-06-30
100 000 
2 632  /m²(38 m²)
Sale
Apartments
Apartment
2 rooms
38 m2
1 outbuilding
2025-06-30
106 000 
4 818  /m²(22 m²)
Sale
Apartments
Apartment
1 room
22 m2
1 outbuilding
2025-06-30
175 000 
3 125  /m²(56 m²)
Sale
Apartments
Apartment
2 rooms
56 m2
1 outbuilding
2025-06-30
71 600 
2 310  /m²(31 m²)
Sale
Apartments
Apartment
1 room
31 m2
3 outbuildings
2025-06-30
12 000 
Sale
1 outbuilding
2025-06-30
94 000 
1 593  /m²(59 m²)
Sale
Apartments
Apartment
3 rooms
59 m2
1 outbuilding
1 outbuilding
2025-06-30
479 700 
4 703  /m²(102 m²)
Sale
Apartments
Apartment
5 rooms
102 m2
1 outbuilding
1 outbuilding
2025-06-30
205 989 
2 985  /m²(69 m²)
Sale
Apartments
Apartment
3 rooms
69 m2
1 outbuilding
142369 transactions listed in the municipality

Haute-Garonne (31)

Most expensive cities

City
name
Descending orderHouses
house
Price per m²
3 998 
3 940 
3 830 
3 818 
3 782 
3 738 
3 698 
3 676 
3 617 
City
name
Descending orderApartments
apt.
Price per m²
5 212 
3 780 
3 396 
3 384 
3 358 
3 260 
3 252 

Least expensive cities

City
name
Ascending orderHouses
house
Price per m²
594 
756 
794 
795 
825 
City
name
Ascending orderApartments
apt.
Price per m²
202 
212 
230 
278 
294