Median price of real estate
in the municipality of Sumène
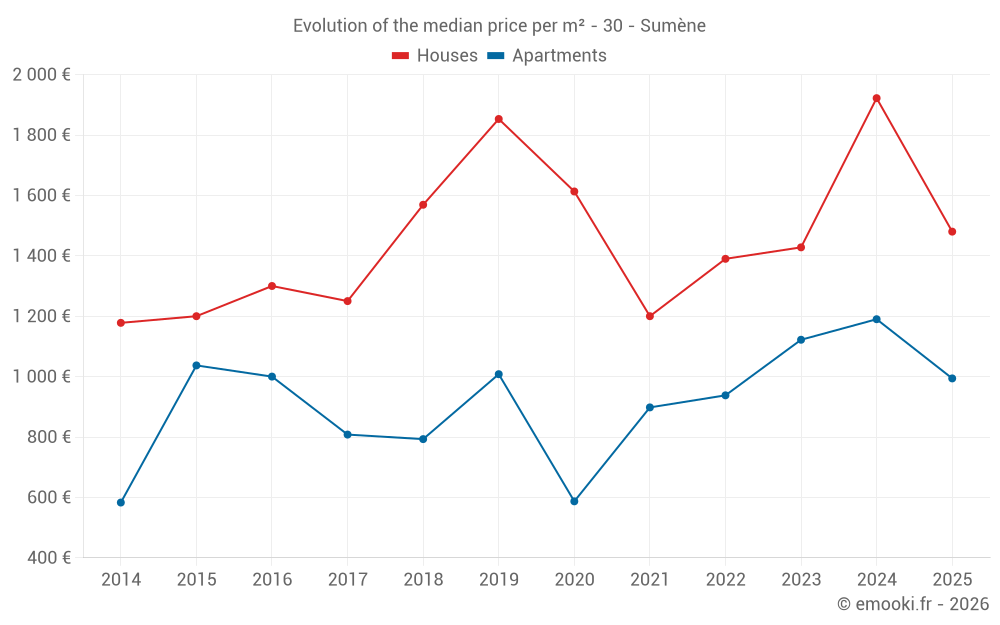
Houses
1 894 € /m²
Reliability 7/10
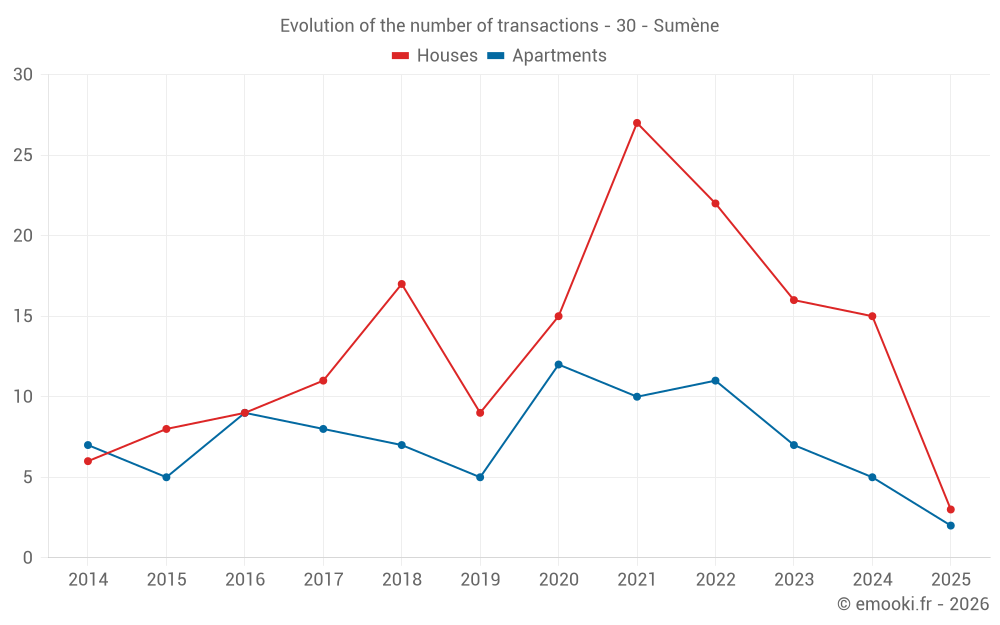
Median price on the 28 transactions of the last 24 months.
from 1 099 to
2 319 € /m²
2 319 € /m²
60% of transactions from the 2nd to the 8th deciles.
Apartments
1 008 € /m²
Reliability 6/10
Median price on the 18 transactions of the last 36 months.
from 403 to
1 584 € /m²
1 584 € /m²
60% of transactions from the 2nd to the 8th deciles.
Dwellings
1 470 € /m²
Reliability 7/10
Median price on the 40 transactions of the last 24 months.
from 715 to
2 301 € /m²
2 301 € /m²
60% of transactions from the 2nd to the 8th deciles.