emooki
HomePrice mapTransactions
🇬🇧 English🇫🇷 Français🇩🇪 Deutsch🇪🇸 Español🇮🇹 Italiano

Real estate price map


Real estate price map in the municipality of Saint-Nazaire, choose a section to see transactions by parcel.

Gard (30)

Saint-Nazaire - Real estate price m²

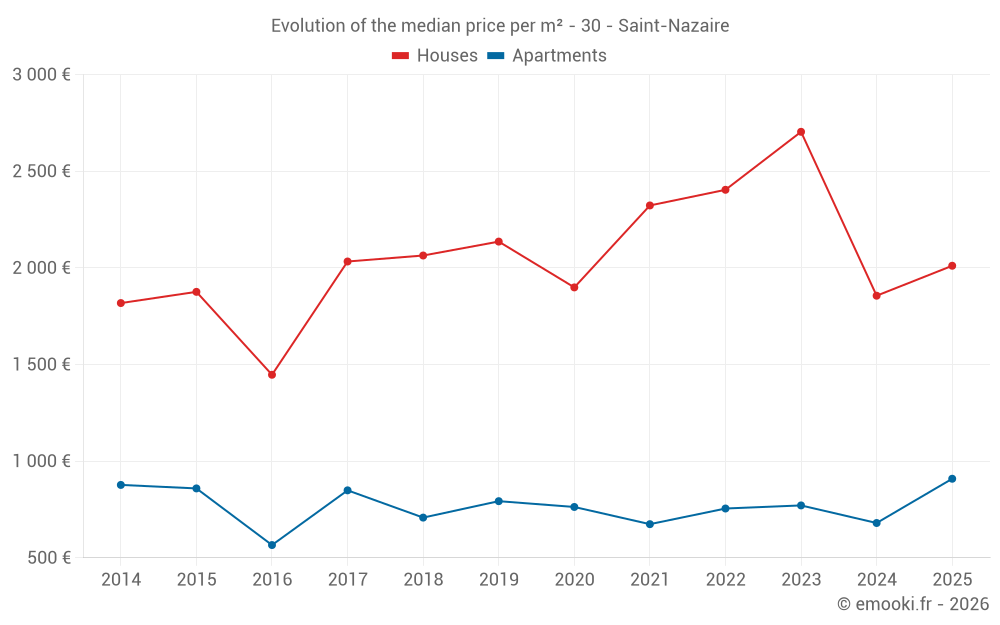
Median price of real estate
in the municipality of Saint-Nazaire

HousesHouses
2 115  /m²
1-23-45-67-89-10
Reliability 6/10
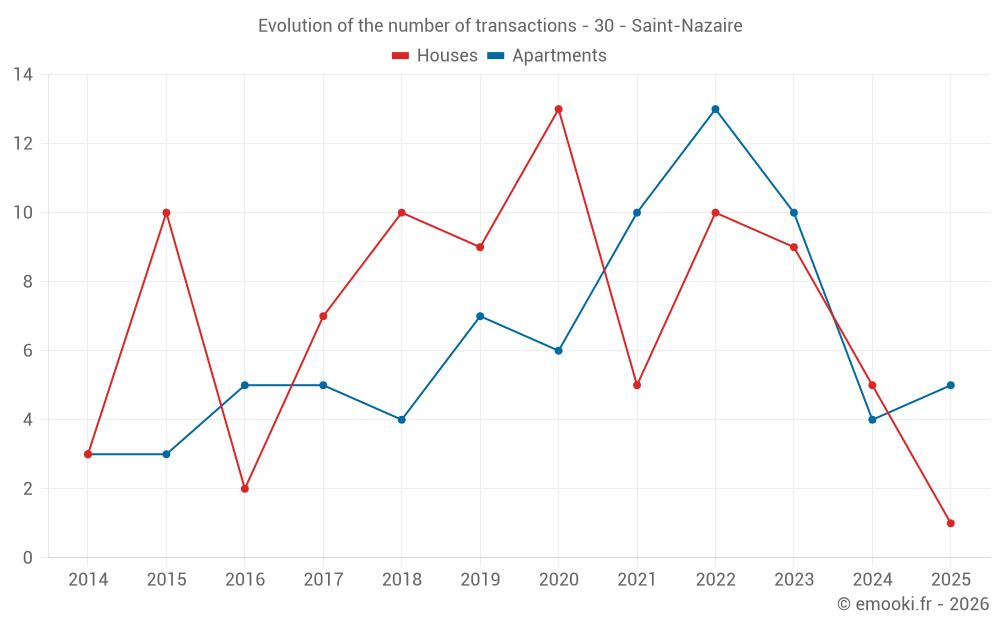
Median price on the 19 transactions of the last 36 months.
from 1 606 to
2 856  /m²
60% of transactions from the 2nd to the 8th deciles.
ApartmentsApartments
758  /m²
1-23-45-67-89-10
Reliability 7/10
Median price on the 14 transactions of the last 24 months.
from 573 to
1 379  /m²
60% of transactions from the 2nd to the 8th deciles.
DwellingsDwellings
1 278  /m²
1-23-45-67-89-10
Reliability 7/10
Median price on the 25 transactions of the last 24 months.
from 706 to
2 132  /m²
60% of transactions from the 2nd to the 8th deciles.
ApartmentsEvolution of the price per m² of apartments since...
1 year
+34%
2 years
+18%
3 years
+20%
4 years
+35%
5 years
+19%
6 years
+15%
7 years
+28%
8 years
+7.1%
9 years
+61%
10 years
--
11 years
--

Yearly evolution

Evolution of the median price per m²

Evolution of the median price per m² - 30 - Saint-Nazaire

Evolution of the number of transactions

Warning, last year incomplete. Projections made based on the proportions between semesters of the previous year at the departmental/national level and by type of property.

Evolution of the number of transactions - 30 - Saint-Nazaire

Yearly data

Descending order
Year
Houses
house
transactions
Houses
house
Price per m²
Apartments
apt.
transactions
Apartments
apt.
Price per m²
2025
1
2 011 
5
909 
2024
5
1 856 
4
680 
2023
9
2 704 
10
771 
2022
10
2 404 
13
755 
2021
5
2 323 
10
674 
2020
13
1 899 
6
763 
2019
9
2 136 
7
793 
2018
10
2 064 
4
708 
2017
7
2 033 
5
849 
2016
2
1 447 
5
566 
2015
10
1 876 
3
859 
2014
3
1 818 
3
877 

Analysis

Structure of prices per m²

Values of price percentiles per m² over the periods used for the estimated price of each type of property.

Structure of transaction amounts

Values of transaction amounts percentiles over the periods used for the estimated price of each type of property.

Transaction amounts and prices per m² by percentile

Ascending order
Percentile
Houses
house
Price per m²
Houses
house
Transaction amount
Apartments
apt.
Price per m²
Apartments
apt.
Transaction amount
10th percentile
1 255 
99 400 
492 
31 500 
20th percentile
1 606 
156 K
573 
36 200 
30th percentile
1 884 
168 K
652 
37 900 
40th percentile
2 031 
176 K
721 
39 120 
50th percentile
2 115 
189 K
758 
40 800 
60th percentile
2 198 
214 K
790 
43 600 
70th percentile
2 725 
296 K
838 
52 700 
80th percentile
2 856 
342 K
1 379 
104 K
90th percentile
3 212 
391 K
2 305 
147 K

National and departmental comparison

Evolution of the median price per m² of houses

Evolution of the median price per m² of apartments

Quarterly evolution

Evolution of the median price per m²

Evolution of the number of transactions

Quarterly data

Descending order
Quarter
Houses
house
transactions
Houses
house
Price per m²
Apartments
apt.
transactions
Apartments
apt.
Price per m²
2025 Q2
0
--- 
3
909 
2025 Q1
1
2 011 
2
1 372 
2024 Q4
3
2 113 
3
578 
2024 Q3
2
1 760 
1
2 400 
2023 Q4
5
2 115 
1
566 
2023 Q3
0
--- 
4
764 
2023 Q2
2
3 152 
2
821 
2023 Q1
2
2 333 
3
830 
2022 Q4
1
2 886 
2
642 
2022 Q3
3
2 188 
4
726 
2022 Q2
5
2 133 
5
703 
2022 Q1
1
2 619 
2
802 
2021 Q4
2
2 642 
3
717 
2021 Q3
0
--- 
4
674 
2021 Q2
2
2 428 
2
642 
2021 Q1
1
2 300 
1
438 
2020 Q4
4
1 715 
0
--- 
2020 Q3
1
2 184 
1
581 
2020 Q2
3
2 073 
3
698 
2020 Q1
5
1 667 
2
1 591 
2019 Q4
2
2 174 
3
813 
2019 Q3
3
1 754 
1
802 
2019 Q2
1
2 054 
1
742 
2019 Q1
3
2 555 
2
514 
2018 Q4
3
2 097 
1
469 
2018 Q3
1
2 154 
1
566 
2018 Q2
3
2 032 
1
850 
2018 Q1
3
1 082 
1
987 
2017 Q4
3
1 753 
2
974 
2017 Q3
1
1 993 
2
1 508 
2017 Q2
0
--- 
1
849 
2017 Q1
3
2 135 
0
--- 
2016 Q3
1
1 968 
0
--- 
2016 Q2
0
--- 
4
642 
2016 Q1
1
926 
1
566 
2015 Q4
2
2 228 
1
724 
2015 Q3
4
1 934 
0
--- 
2015 Q2
4
1 389 
0
--- 
2015 Q1
0
--- 
2
877 
2014 Q4
1
1 818 
0
--- 
2014 Q2
1
1 899 
2
896 
2014 Q1
1
1 451 
1
469 

Overview of the latest real estate transactions

The following list is an anonymized overview of the latest transactions. For more details and to find all transactions, please use the map to view transactions by plot or the transaction search page for a search by criteria.

2025-05-27
77 000 
2 750  /m²(28 m²)
Sale
Apartments
Apartment
1 room
28 m2
Land
259 m2
-Sols
Land
231 m2
-Sols
2025-04-25
300 000 
909  /m²(330 m²)
Sale
Apartments
Apartment
4 rooms
110 m2
Apartments
Apartment
4 rooms
110 m2
Apartments
Apartment
4 rooms
110 m2
Land
304 m2
-Sols
2025-04-25
600 
Sale
Land
204 m2
-Jardins
/Jardin potager
2025-04-16
38 000 
717  /m²(53 m²)
Sale
Apartments
Apartment
3 rooms
53 m2
1 outbuilding
2025-03-21
181 000 
2 011  /m²(90 m²)
Sale
Houses
House
5 rooms
90 m2
Land
1000 m2
-Sols
2025-02-20
35 000 
660  /m²(53 m²)
Sale
Apartments
Apartment
3 rooms
53 m2
1 outbuilding
2025-01-09
147 940 
2 084  /m²(71 m²)
Sale
Apartments
Apartment
1 room
71 m2
2025-01-06
4 000 
Sale
Land
3479 m2
-Vignes
Land
3546 m2
-Vignes
Land
540 m2
-Landes
Land
600 m2
-Taillis simples
Land
8810 m2
-Landes
Land
6286 m2
-Landes
Land
581 m2
-Landes
Land
2380 m2
-Vignes
Land
1148 m2
-Taillis simples
Land
5039 m2
-Terres
Land
259 m2
-Terres
2024-12-13
330 000 
2 200  /m²(150 m²)
Sale
Houses
House
6 rooms
150 m2
1 outbuilding
Land
2650 m2
-Landes
Land
1000 m2
-Sols
2024-12-09
70 000 
Sale
Land
1689 m2
-Terres
2024-11-28
100 000 
1 163  /m²(86 m²)
Sale
Houses
House
4 rooms
86 m2
Land
295 m2
-Sols
2024-11-05
37 000 
578  /m²(64 m²)
Sale
Apartments
Apartment
4 rooms
64 m2
1 outbuilding
2024-10-30
355 000 
2 113  /m²(168 m²)
Sale
Houses
House
4 rooms
168 m2
1 outbuilding
Land
1000 m2
-Sols
Land
777 m2
-Terrains d'agrément
2024-10-23
1 300 000 
870  /m²(1494 m²)
16 250  /m²(80 m²)
Sale
Houses
House
4 rooms
80 m2
Commercial property
1414 m2
Land
5003 m2
-Landes
Land
1000 m2
-Sols
Land
364 m2
-Landes
Land
3281 m2
-Landes
2024-10-17
50 000 
781  /m²(64 m²)
Sale
Apartments
Apartment
4 rooms
64 m2
1 outbuilding
2024-10-04
5 000 
Sale
Land
1948 m2
-Terres
2024-10-03
29 500 
461  /m²(64 m²)
Sale
Apartments
Apartment
4 rooms
64 m2
1 outbuilding
2024-09-19
144 000 
2 400  /m²(60 m²)
Sale
Apartments
Apartment
3 rooms
60 m2
Land
142 m2
-Sols
Land
122 m2
-Sols
2024-09-12
1 000 
Sale
Land
7205 m2
-Taillis simples
2024-08-30
550 962 
1 665  /m²(331 m²)
Sale
Apartments
Apartment
2 rooms
30 m2
Apartments
Apartment
3 rooms
50 m2
Apartments
Apartment
2 rooms
28 m2
Apartments
Apartment
3 rooms
55 m2
Apartments
Apartment
3 rooms
50 m2
Houses
House
5 rooms
118 m2
3 outbuildings
Land
3465 m2
-Sols
Land
54 m2
-Terres
277 transactions listed in the municipality

Gard (30)

Most expensive cities

City
name
Descending orderHouses
house
Price per m²
4 483 
4 034 
3 942 
3 835 
3 606 
3 505 
City
name
Descending orderApartments
apt.
Price per m²
5 174 
5 102 
3 626 
3 553 
3 286 
3 112 
2 994 
2 960 

Least expensive cities

City
name
Ascending orderHouses
house
Price per m²
838 
846 
988 
1 057 
1 135 
1 140 
1 216 
1 226 
City
name
Ascending orderApartments
apt.
Price per m²
188 
208 
300 
340 
438 
558 
600