emooki
HomePrice mapTransactions
🇬🇧 English🇫🇷 Français🇩🇪 Deutsch🇪🇸 Español🇮🇹 Italiano

Real estate price map


Real estate price map in the municipality of Meyrannes.

Gard (30)
Meyrannes

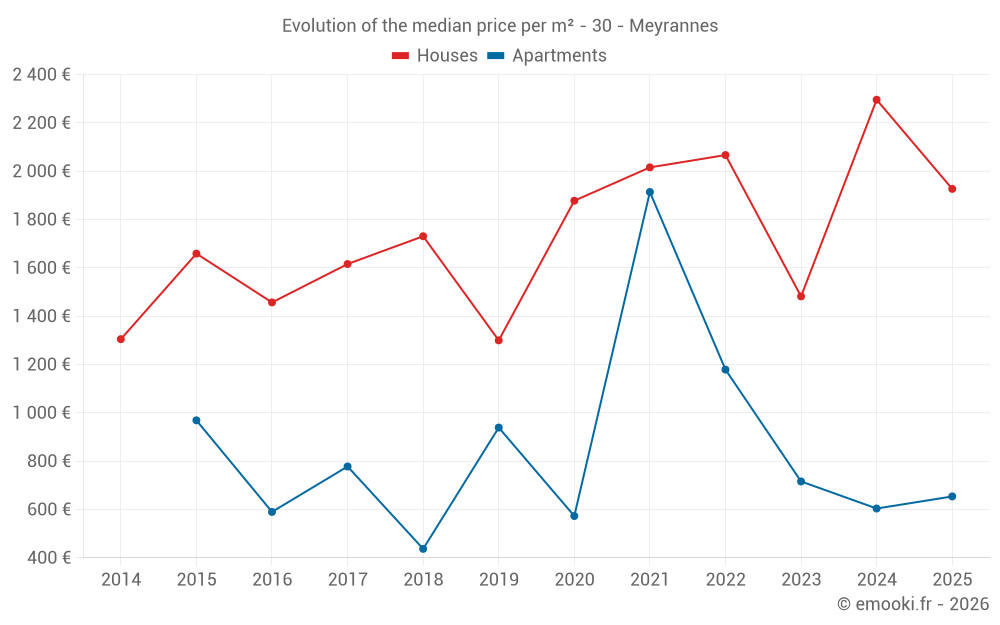
Median price of real estate
in the municipality of Meyrannes

HousesHouses
2 227 € /m²
1-23-45-67-89-10
Reliability 6/10
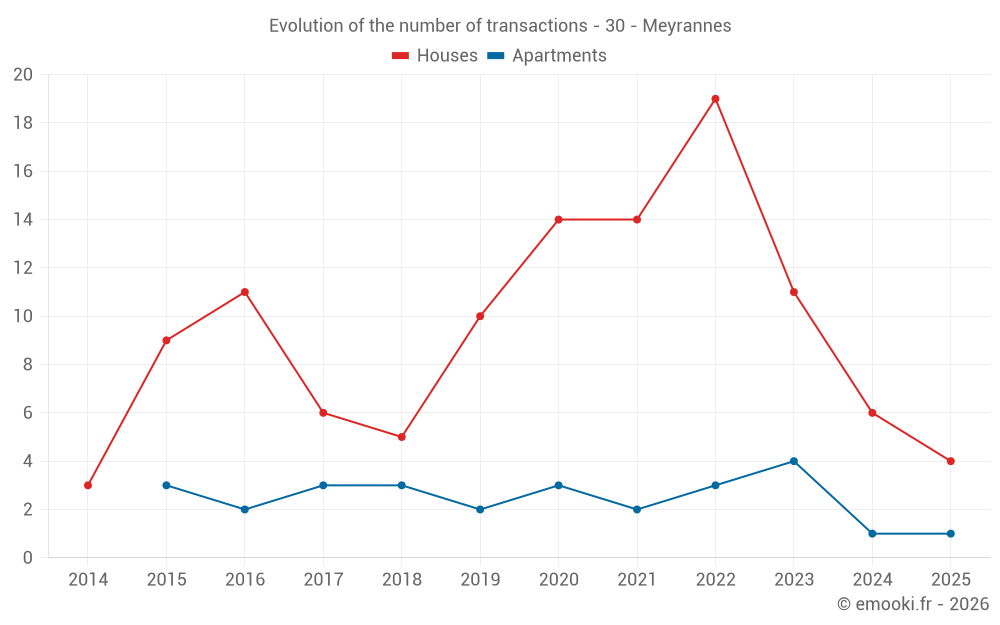
Median price on the 29 transactions of the last 36 months.
from 1 417 to
2 981 € /m²
60% of transactions from the 2nd to the 8th deciles.
ApartmentsApartments
733 € /m²
1-23-45-67-89-10
Reliability 5/10
Median price on the 11 transactions of the last 48 months.
from 604 to
1 883 € /m²
60% of transactions from the 2nd to the 8th deciles.
DwellingsDwellings
2 092 € /m²
1-23-45-67-89-10
Reliability 7/10
Median price on the 14 transactions of the last 24 months.
from 1 071 to
2 857 € /m²
60% of transactions from the 2nd to the 8th deciles.
HousesEvolution of the price per m² of houses
1 year
--
2 years
--
3 years
--
4 years
--
5 years
--
6 years
--
7 years
--
8 years
--
9 years
--
10 years
--
11 years
--
ApartmentsEvolution of the price per m² of apartments
1 year
--
2 years
--
3 years
--
4 years
--
5 years
--
6 years
--
7 years
--
8 years
--
9 years
--
10 years
--
11 years
--

Yearly evolution

Median price per m²

Number of transactions

Warning, last year incomplete. Projections made based on the proportions between semesters of the previous year at the departmental/national level and by type of property.

Yearly data

Descending order
Year
Houses
house
Price per m²
Houses
house
transactions
Apartments
apt.
Price per m²
Apartments
apt.
transactions
2025
1 927 €
4
654 €
1
2024
2 296 €
6
604 €
1
2023
1 482 €
11
716 €
4
2022
2 067 €
19
1 179 €
3
2021
2 016 €
14
1 914 €
2
2020
1 878 €
14
573 €
3
2019
1 300 €
10
939 €
2
2018
1 731 €
5
437 €
3
2017
1 616 €
6
778 €
3
2016
1 457 €
11
590 €
2
2015
1 659 €
9
969 €
3
2014
1 305 €
3
--- €
0

Analysis

Structure of prices per m²

Values of price percentiles per m² over the periods used for the estimated price of each type of property.

Structure of transaction amounts

Values of transaction amounts percentiles over the periods used for the estimated price of each type of property.

Transaction amounts and prices per m² by percentile

Ascending order
Percentile
Houses
house
Price per m²
Houses
house
Transaction amount
Apartments
apt.
Price per m²
Apartments
apt.
Transaction amount
10th percentile
891 €
92 420 €
498 €
58 000 €
20th percentile
1 417 €
149 000 €
604 €
85 000 €
30th percentile
1 605 €
167 800 €
654 €
90 000 €
40th percentile
1 854 €
173 600 €
699 €
92 000 €
50th percentile
2 227 €
190 000 €
733 €
104 000 €
60th percentile
2 438 €
210 800 €
904 €
120 000 €
70th percentile
2 761 €
252 400 €
1 179 €
145 000 €
80th percentile
2 981 €
267 036 €
1 883 €
208 000 €
90th percentile
3 076 €
292 400 €
1 944 €
273 790 €

Quarterly evolution

Median price per m²

Number of transactions

Quarterly data

Descending order
Quarter
Houses
house
Price per m²
Houses
house
transactions
Apartments
apt.
Price per m²
Apartments
apt.
transactions
2025 Q2
1 828 €
2
--- €
0
2025 Q1
2 250 €
2
654 €
1
2024 Q3
2 227 €
3
--- €
0
2024 Q2
3 185 €
2
--- €
0
2024 Q1
1 958 €
1
604 €
1
2023 Q4
2 774 €
1
699 €
1
2023 Q2
1 825 €
7
733 €
1
2023 Q1
833 €
3
626 €
2
2022 Q4
2 974 €
4
498 €
1
2022 Q3
2 404 €
4
1 179 €
1
2022 Q2
1 818 €
5
2 028 €
1
2022 Q1
1 706 €
6
--- €
0
2021 Q4
1 212 €
4
1 883 €
1
2021 Q3
2 231 €
5
1 944 €
1
2021 Q2
2 129 €
3
--- €
0
2021 Q1
2 188 €
2
--- €
0
2020 Q4
1 974 €
6
--- €
0
2020 Q3
1 628 €
4
--- €
0
2020 Q2
2 202 €
1
692 €
2
2020 Q1
1 517 €
3
533 €
1
2019 Q4
1 168 €
1
--- €
0
2019 Q3
1 514 €
6
--- €
0
2019 Q2
1 487 €
2
--- €
0
2019 Q1
906 €
1
939 €
2
2018 Q4
1 848 €
4
1 950 €
1
2018 Q3
--- €
0
304 €
2
2018 Q2
1 082 €
1
--- €
0
2017 Q4
--- €
0
1 125 €
1
2017 Q3
1 616 €
4
--- €
0
2017 Q2
1 000 €
1
778 €
1
2017 Q1
1 794 €
1
190 €
1
2016 Q4
1 500 €
3
590 €
2
2016 Q3
1 364 €
1
--- €
0
2016 Q2
1 457 €
5
--- €
0
2016 Q1
1 334 €
2
--- €
0
2015 Q4
1 659 €
3
--- €
0
2015 Q3
527 €
1
969 €
1
2015 Q2
1 690 €
3
2 667 €
1
2015 Q1
1 758 €
2
647 €
1
2014 Q4
1 305 €
1
--- €
0
2014 Q1
1 393 €
2
--- €
0

Gard (30)

Most expensive cities

City
name
Descending orderHouses
house
Price per m²
4 483 €
4 034 €
3 975 €
3 942 €
3 835 €
3 669 €
3 606 €
3 598 €
3 554 €
3 505 €
City
name
Descending orderApartments
apt.
Price per m²
5 174 €
5 102 €
3 626 €
3 553 €
3 286 €
3 250 €
3 112 €
2 994 €
2 960 €
2 929 €

Least expensive cities

City
name
Ascending orderHouses
house
Price per m²
838 €
846 €
988 €
1 057 €
1 135 €
1 136 €
1 140 €
1 216 €
1 226 €
1 230 €
City
name
Ascending orderApartments
apt.
Price per m²
75 €
188 €
208 €
300 €
340 €
438 €
495 €
523 €
558 €
600 €