emooki
HomePrice mapTransactions
🇬🇧 English🇫🇷 Français🇩🇪 Deutsch🇪🇸 Español🇮🇹 Italiano

Real estate price map


Real estate price map in the municipality of Méjannes-lès-Alès.

Gard (30)
Méjannes-lès-Alès

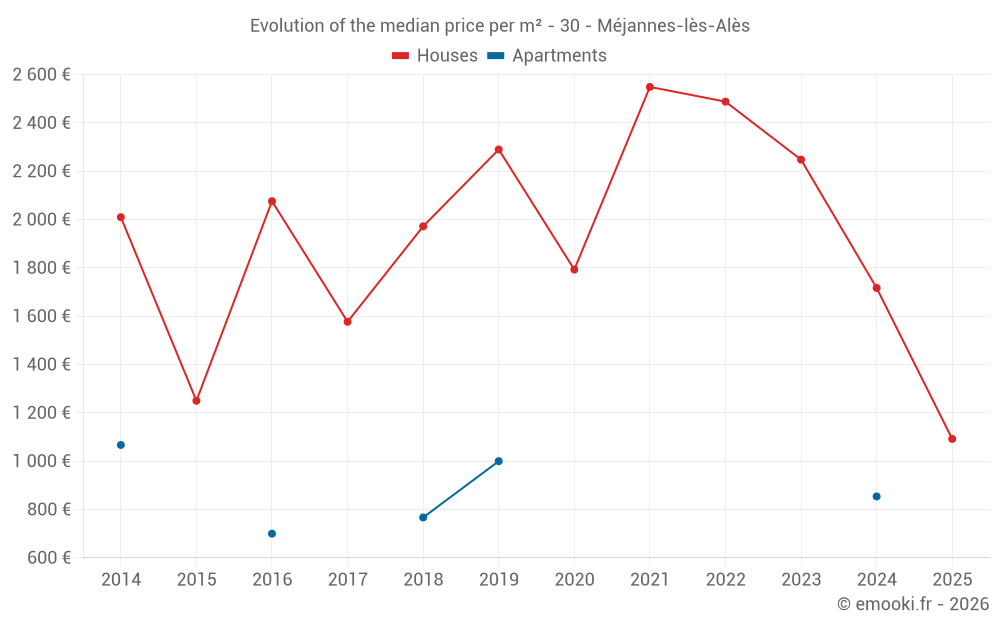
Median price of real estate
in the municipality of Méjannes-lès-Alès

HousesHouses
1 808  /m²
1-23-45-67-89-10
Reliability 7/10
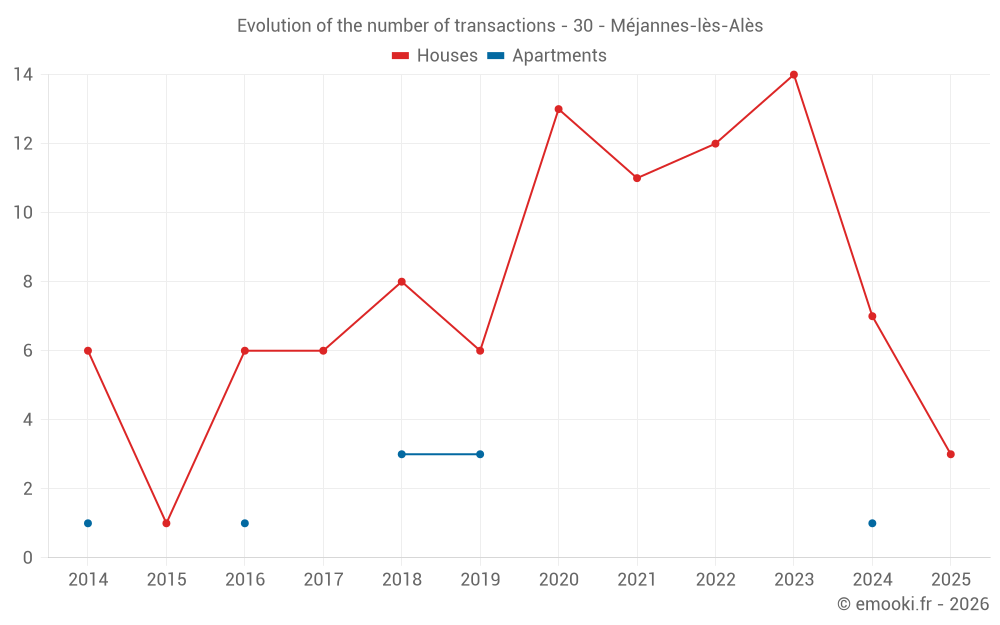
Median price on the 14 transactions of the last 24 months.
from 1 068 to
2 600  /m²
60% of transactions from the 2nd to the 8th deciles.
ApartmentsApartments
932  /m²
1-23-45-67-89-10
Reliability 2/10
Median price on the 7 transactions of the last 96 months.
DwellingsDwellings
1 717  /m²
1-23-45-67-89-10
Reliability 7/10
Median price on the 15 transactions of the last 24 months.
from 1 026 to
2 579  /m²
60% of transactions from the 2nd to the 8th deciles.
HousesEvolution of the price per m² of houses since...
1 year
--
2 years
--
3 years
--
4 years
--
5 years
--
6 years
--
7 years
--
8 years
--
9 years
--
10 years
--
11 years
--
ApartmentsEvolution of the price per m² of apartments since...
1 year
--
2 years
--
3 years
--
4 years
--
5 years
--
6 years
--
7 years
--
8 years
--
9 years
--
10 years
--
11 years
--

Yearly evolution

Evolution of the median price per m²

Evolution of the number of transactions

Warning, last year incomplete. Projections made based on the proportions between semesters of the previous year at the departmental/national level and by type of property.

Yearly data

Descending order
Year
Houses
house
transactions
Houses
house
Price per m²
Apartments
apt.
transactions
Apartments
apt.
Price per m²
2025
3
1 092 
0
--- 
2024
7
1 717 
1
854 
2023
14
2 248 
0
--- 
2022
12
2 488 
0
--- 
2021
11
2 549 
0
--- 
2020
13
1 793 
0
--- 
2019
6
2 290 
3
1 000 
2018
8
1 972 
3
767 
2017
6
1 577 
0
--- 
2016
6
2 076 
1
700 
2015
1
1 250 
0
--- 
2014
6
2 010 
1
1 067 

Analysis

Structure of prices per m²

Values of price percentiles per m² over the periods used for the estimated price of each type of property.

Structure of transaction amounts

Values of transaction amounts percentiles over the periods used for the estimated price of each type of property.

Transaction amounts and prices per m² by percentile

Ascending order
Percentile
Houses
house
Price per m²
Houses
house
Transaction amount
Apartments
apt.
Price per m²
Apartments
apt.
Transaction amount
10th percentile
1 010 
112 K
623 
51 400 
20th percentile
1 068 
157 K
784 
55 000 
30th percentile
1 103 
166 K
837 
55 000 
40th percentile
1 387 
182 K
885 
59 000 
50th percentile
1 808 
201 K
932 
65 000 
60th percentile
2 140 
217 K
973 
87 200 
70th percentile
2 322 
229 K
1 032 
103 K
80th percentile
2 600 
261 K
1 129 
107 K
90th percentile
2 709 
281 K
1 185 
121 K

National and departmental comparison

Evolution of the median price per m² of houses

Evolution of the median price per m² of apartments

Quarterly evolution

Evolution of the median price per m²

Evolution of the number of transactions

Quarterly data

Descending order
Quarter
Houses
house
transactions
Houses
house
Price per m²
Apartments
apt.
transactions
Apartments
apt.
Price per m²
2025 Q2
3
1 092 
0
--- 
2024 Q4
3
1 304 
0
--- 
2024 Q3
1
2 729 
0
--- 
2024 Q2
1
1 717 
1
854 
2024 Q1
2
2 338 
0
--- 
2023 Q4
1
682 
0
--- 
2023 Q3
3
2 200 
0
--- 
2023 Q2
8
2 595 
0
--- 
2023 Q1
2
2 170 
0
--- 
2022 Q4
2
2 926 
0
--- 
2022 Q3
3
2 741 
0
--- 
2022 Q2
2
1 274 
0
--- 
2022 Q1
5
2 348 
0
--- 
2021 Q4
4
2 723 
0
--- 
2021 Q3
3
2 090 
0
--- 
2021 Q2
3
2 689 
0
--- 
2021 Q1
1
1 524 
0
--- 
2020 Q4
1
1 651 
0
--- 
2020 Q3
6
2 127 
0
--- 
2020 Q2
4
1 740 
0
--- 
2020 Q1
2
1 578 
0
--- 
2019 Q4
0
--- 
1
932 
2019 Q3
2
2 290 
0
--- 
2019 Q2
2
1 633 
1
1 000 
2019 Q1
2
2 419 
1
1 161 
2018 Q4
4
2 008 
1
767 
2018 Q3
1
1 951 
2
815 
2018 Q2
1
2 575 
0
--- 
2018 Q1
2
1 478 
0
--- 
2017 Q4
1
1 639 
0
--- 
2017 Q3
2
2 558 
0
--- 
2017 Q2
2
1 202 
0
--- 
2017 Q1
1
561 
0
--- 
2016 Q4
1
2 509 
0
--- 
2016 Q3
1
1 830 
0
--- 
2016 Q2
3
1 870 
1
700 
2016 Q1
1
2 449 
0
--- 
2015 Q4
1
1 250 
0
--- 
2014 Q4
0
--- 
1
1 067 
2014 Q3
1
2 262 
0
--- 
2014 Q2
4
2 051 
0
--- 
2014 Q1
1
1 000 
0
--- 

Gard (30)

Most expensive cities

City
name
Descending orderHouses
house
Price per m²
4 483 
4 034 
3 942 
3 835 
3 606 
3 505 
City
name
Descending orderApartments
apt.
Price per m²
5 174 
5 102 
3 626 
3 553 
3 286 
3 112 
2 994 
2 960 

Least expensive cities

City
name
Ascending orderHouses
house
Price per m²
838 
846 
988 
1 057 
1 135 
1 140 
1 216 
1 226 
City
name
Ascending orderApartments
apt.
Price per m²
188 
208 
300 
340 
438 
558 
600