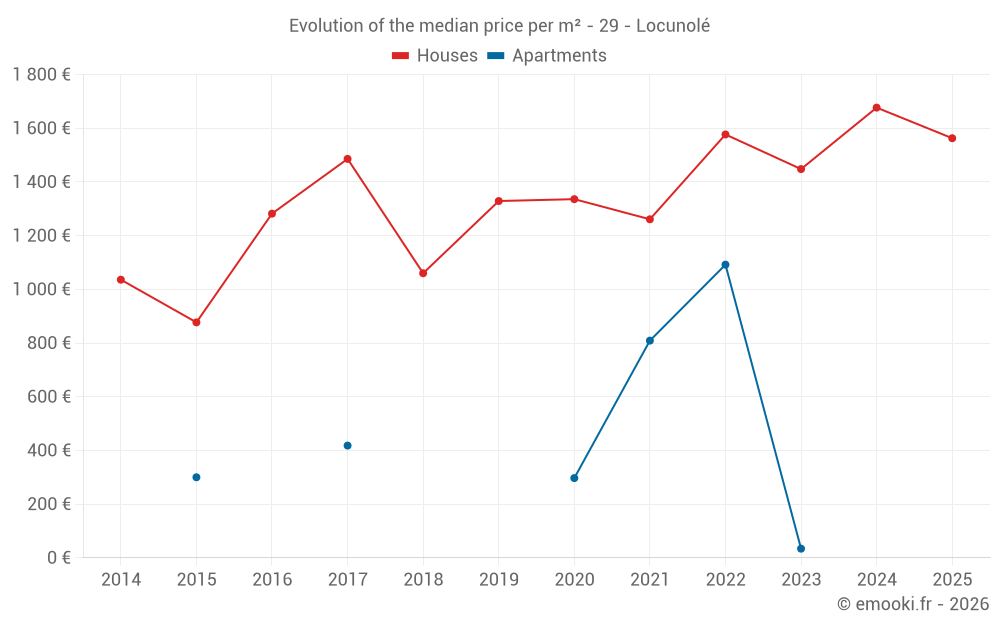
Median price of real estate
in the municipality of Locunolé
Houses
1 606 € /m²
Reliability 7/10
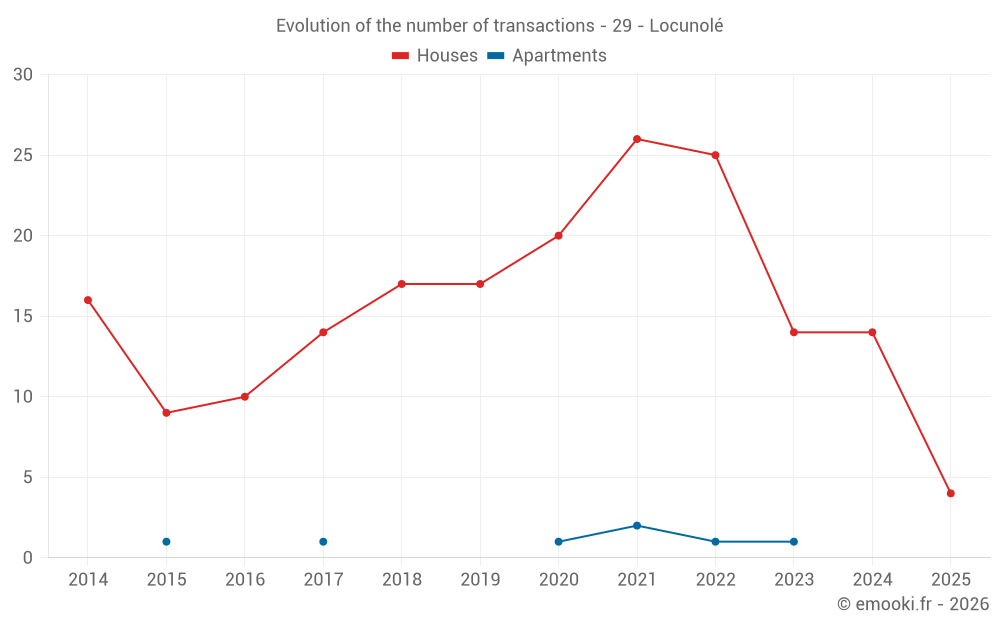
Median price on the 25 transactions of the last 24 months.
from 1 272 to
2 100 € /m²
2 100 € /m²
60% of transactions from the 2nd to the 8th deciles.
Apartments
570 € /m²
Reliability 2/10
Median price on the 6 transactions of the last 96 months.
Dwellings
1 606 € /m²
Reliability 7/10
Median price on the 25 transactions of the last 24 months.
from 1 272 to
2 100 € /m²
2 100 € /m²
60% of transactions from the 2nd to the 8th deciles.