emooki
HomePrice mapTransactions
🇬🇧 English🇫🇷 Français🇩🇪 Deutsch🇪🇸 Español🇮🇹 Italiano

Real estate price map


Real estate price map in the municipality of Lesneven, choose a section to see transactions by parcel.

Finistère (29)

Lesneven - Real estate price m²

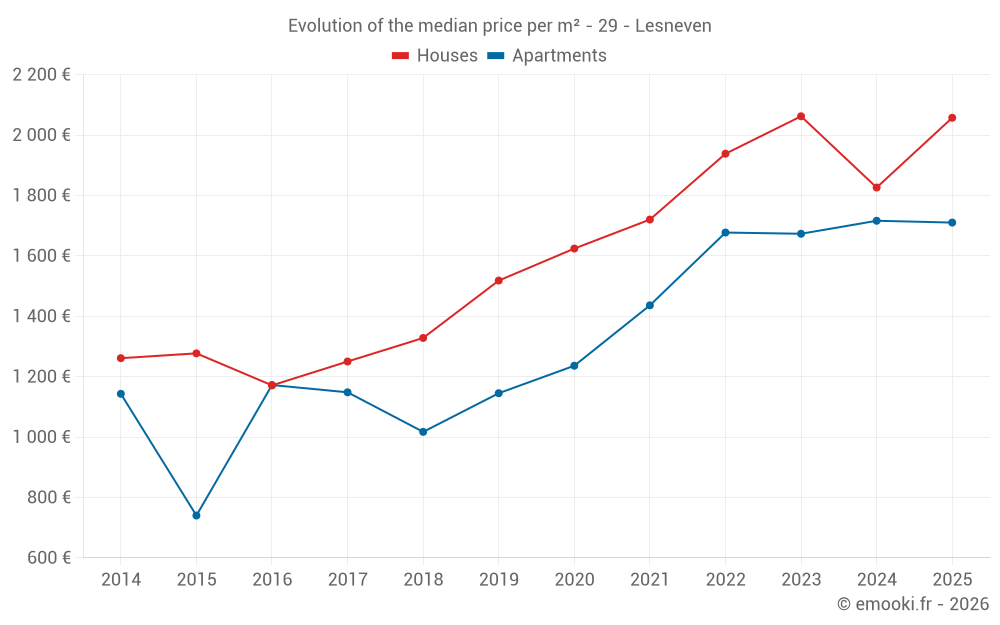
Median price of real estate
in the municipality of Lesneven

HousesHouses
2 014  /m²
1-23-45-67-89-10
Reliability 10/10
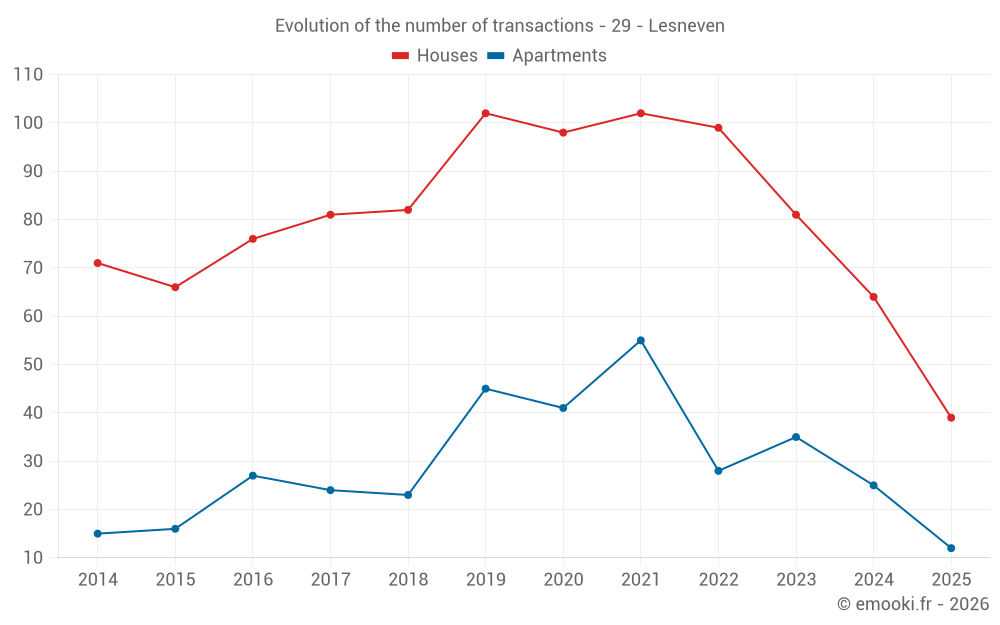
Median price on the 22 transactions of the last 3 months.
from 1 682 to
2 298  /m²
60% of transactions from the 2nd to the 8th deciles.
ApartmentsApartments
1 727  /m²
1-23-45-67-89-10
Reliability 8/10
Median price on the 27 transactions of the last 12 months.
from 1 434 to
1 949  /m²
60% of transactions from the 2nd to the 8th deciles.
DwellingsDwellings
1 988  /m²
1-23-45-67-89-10
Reliability 10/10
Median price on the 26 transactions of the last 3 months.
from 1 591 to
2 265  /m²
60% of transactions from the 2nd to the 8th deciles.
HousesEvolution of the price per m² of houses since...
1 year
+13%
2 years
-0.2%
3 years
+6.1%
4 years
+20%
5 years
+27%
6 years
+36%
7 years
+55%
8 years
+65%
9 years
+76%
10 years
+61%
11 years
+63%
The price per m² of houses has decreased by 0.2% since 2 years, but it has increased by 76% in 9 years.
ApartmentsEvolution of the price per m² of apartments since...
1 year
-0.3%
2 years
+2.2%
3 years
+2%
4 years
+19%
5 years
+38%
6 years
+49%
7 years
+68%
8 years
+49%
9 years
+46%
10 years
+131%
11 years
+50%
The price per m² of apartments has decreased by 0.3% since 1 year, but it has increased by 131% in 10 years.

Yearly evolution

Evolution of the median price per m²

Evolution of the median price per m² - 29 - Lesneven

Evolution of the number of transactions

Warning, last year incomplete. Projections made based on the proportions between semesters of the previous year at the departmental/national level and by type of property.

Evolution of the number of transactions - 29 - Lesneven

Yearly data

Descending order
Year
Houses
house
transactions
Houses
house
Price per m²
Apartments
apt.
transactions
Apartments
apt.
Price per m²
2025
39
2 057 
12
1 710 
2024
64
1 826 
25
1 716 
2023
81
2 062 
35
1 673 
2022
99
1 938 
28
1 677 
2021
102
1 720 
55
1 436 
2020
98
1 624 
41
1 236 
2019
102
1 518 
45
1 145 
2018
82
1 328 
23
1 017 
2017
81
1 250 
24
1 148 
2016
76
1 171 
27
1 172 
2015
66
1 277 
16
740 
2014
71
1 261 
15
1 143 

Analysis

Structure of prices per m²

Values of price percentiles per m² over the periods used for the estimated price of each type of property.

Structure of transaction amounts

Values of transaction amounts percentiles over the periods used for the estimated price of each type of property.

Transaction amounts and prices per m² by percentile

Ascending order
Percentile
Houses
house
Price per m²
Houses
house
Transaction amount
Apartments
apt.
Price per m²
Apartments
apt.
Transaction amount
10th percentile
1 395 
143 K
1 271 
37 720 
20th percentile
1 682 
168 K
1 434 
57 800 
30th percentile
1 877 
184 K
1 553 
68 404 
40th percentile
1 964 
205 K
1 622 
77 800 
50th percentile
2 014 
225 K
1 727 
86 000 
60th percentile
2 062 
228 K
1 784 
98 000 
70th percentile
2 129 
234 K
1 935 
107 K
80th percentile
2 298 
238 K
1 949 
122 K
90th percentile
2 401 
287 K
2 325 
137 K

National and departmental comparison

Evolution of the median price per m² of houses

Evolution of the median price per m² of apartments

Quarterly evolution

Evolution of the median price per m²

Evolution of the number of transactions

Quarterly data

Descending order
Quarter
Houses
house
transactions
Houses
house
Price per m²
Apartments
apt.
transactions
Apartments
apt.
Price per m²
2025 Q2
22
2 014 
4
1 756 
2025 Q1
17
2 241 
8
1 710 
2024 Q4
20
1 932 
3
898 
2024 Q3
11
1 955 
12
1 766 
2024 Q2
13
1 839 
6
1 622 
2024 Q1
20
1 720 
4
1 688 
2023 Q4
20
2 064 
7
1 673 
2023 Q3
27
2 202 
6
1 574 
2023 Q2
17
2 218 
8
1 674 
2023 Q1
17
1 937 
14
1 628 
2022 Q4
23
1 924 
11
1 667 
2022 Q3
32
1 969 
7
2 105 
2022 Q2
23
1 957 
4
1 596 
2022 Q1
21
1 842 
6
1 588 
2021 Q4
23
1 885 
10
1 111 
2021 Q3
33
1 671 
15
1 548 
2021 Q2
26
1 740 
19
1 518 
2021 Q1
20
1 602 
11
1 250 
2020 Q4
33
1 600 
6
1 228 
2020 Q3
30
1 709 
11
1 177 
2020 Q2
11
1 868 
10
1 297 
2020 Q1
24
1 566 
14
1 234 
2019 Q4
24
1 512 
17
1 091 
2019 Q3
28
1 748 
10
1 238 
2019 Q2
21
1 475 
8
1 182 
2019 Q1
29
1 388 
10
1 001 
2018 Q4
20
1 242 
7
845 
2018 Q3
20
1 331 
5
1 094 
2018 Q2
17
1 426 
6
1 132 
2018 Q1
25
1 367 
5
867 
2017 Q4
20
1 250 
5
1 203 
2017 Q3
21
1 255 
3
939 
2017 Q2
22
1 270 
6
1 091 
2017 Q1
18
1 142 
10
1 153 
2016 Q4
14
1 342 
2
1 228 
2016 Q3
21
1 134 
9
1 159 
2016 Q2
26
1 149 
9
1 029 
2016 Q1
15
1 159 
7
1 250 
2015 Q4
14
1 218 
4
1 301 
2015 Q3
24
1 304 
3
1 296 
2015 Q2
18
1 230 
5
658 
2015 Q1
10
1 328 
4
474 
2014 Q4
15
1 167 
4
1 110 
2014 Q3
17
1 217 
6
1 060 
2014 Q2
23
1 288 
3
1 143 
2014 Q1
16
1 546 
2
1 352 

Overview of the latest real estate transactions

The following list is an anonymized overview of the latest transactions. For more details and to find all transactions, please use the map to view transactions by plot or the transaction search page for a search by criteria.

2025-06-06
177 800 
1 162  /m²(153 m²)
1 411  /m²(126 m²)
Sale
Houses
House
5 rooms
96 m2
Houses
House
2 rooms
30 m2
Commercial property
27 m2
Land
236 m2
-Sols
2025-06-06
193 400 
2 057  /m²(94 m²)
Sale
Houses
House
5 rooms
94 m2
Land
430 m2
-Sols
2025-05-07
140 000 
1 373  /m²(102 m²)
Sale
Houses
House
5 rooms
102 m2
Land
481 m2
-Sols
2025-05-06
70 000 
1 296  /m²(54 m²)
Sale
Apartments
Apartment
2 rooms
54 m2
2025-04-30
290 380 
1 850  /m²(157 m²)
Sale
Houses
House
6 rooms
157 m2
Land
593 m2
-Sols
Land
12 m2
-Sols
2025-04-30
105 000 
Sale
Land
1114 m2
-Terrains à bâtir
2025-04-30
165 000 
1 941  /m²(85 m²)
Sale
Houses
House
5 rooms
85 m2
Land
460 m2
-Sols
2025-04-30
225 000 
1 974  /m²(114 m²)
Sale
Houses
House
5 rooms
114 m2
Land
566 m2
-Sols
2025-04-30
165 000 
1 650  /m²(100 m²)
Sale
Land
59 m2
-Jardins
Houses
House
6 rooms
100 m2
Land
273 m2
-Sols
2025-04-30
285 000 
1 439  /m²(198 m²)
2 227  /m²(128 m²)
Sale
Apartments
Apartment
2 rooms
36 m2
Apartments
Apartment
4 rooms
59 m2
Apartments
Apartment
2 rooms
33 m2
Commercial property
70 m2
5 outbuildings
Land
292 m2
-Sols
2025-04-29
280 000 
1 414  /m²(198 m²)
Sale
Commercial property
198 m2
2025-04-29
188 420 
2 026  /m²(93 m²)
Sale
Land
79 m2
-Sols
Land
24 m2
-Sols
Houses
House
6 rooms
93 m2
Land
125 m2
-Sols
Land
270 m2
-Sols
2025-04-29
253 700 
2 114  /m²(120 m²)
Sale
Houses
House
5 rooms
120 m2
Land
522 m2
-Sols
2025-04-29
160 000 
350  /m²(457 m²)
1 240  /m²(129 m²)
Sale
Apartments
Apartment
4 rooms
129 m2
Commercial property
328 m2
2 outbuildings
Land
245 m2
-Sols
2025-04-29
32 895 
1 566  /m²(21 m²)
Sale
Apartments
Apartment
2 rooms
21 m2
2025-04-28
225 000 
2 320  /m²(97 m²)
Sale
Houses
House
5 rooms
97 m2
Land
597 m2
-Sols
2025-04-28
230 000 
2 212  /m²(104 m²)
Sale
Houses
House
6 rooms
104 m2
Land
494 m2
-Sols
2025-04-25
30 000 
811  /m²(37 m²)
Sale
Houses
House
2 rooms
37 m2
Land
46 m2
-Sols
2025-04-24
558 000 
3 033  /m²(184 m²)
Sale
Houses
House
9 rooms
184 m2
1 outbuilding
Land
742 m2
-Sols
Land
1357 m2
-Terrains d'agrément
2025-04-22
236 000 
2 408  /m²(98 m²)
Sale
Houses
House
6 rooms
98 m2
Land
668 m2
-Sols
1882 transactions listed in the municipality

Finistère (29)

Most expensive cities

City
name
Descending orderHouses
house
Price per m²
3 989 
3 766 
3 461 
3 428 
3 146 
3 102 
3 044 
2 965 
City
name
Descending orderApartments
apt.
Price per m²
4 592 
4 260 
4 097 
3 933 
3 778 
3 210 
3 200 
3 066 

Least expensive cities

City
name
Ascending orderHouses
house
Price per m²
750 
792 
793 
830 
878 
889 
934 
935 
943 
City
name
Ascending orderApartments
apt.
Price per m²
200 
232 
312 
320 
339 
365 
388 
399 
415