emooki
HomePrice mapTransactions
🇬🇧 English🇫🇷 Français🇩🇪 Deutsch🇪🇸 Español🇮🇹 Italiano

Real estate price map


Real estate price map in the municipality of Lampaul-Plouarzel, choose a section to see transactions by parcel.

Finistère (29)

Lampaul-Plouarzel - Real estate price m²

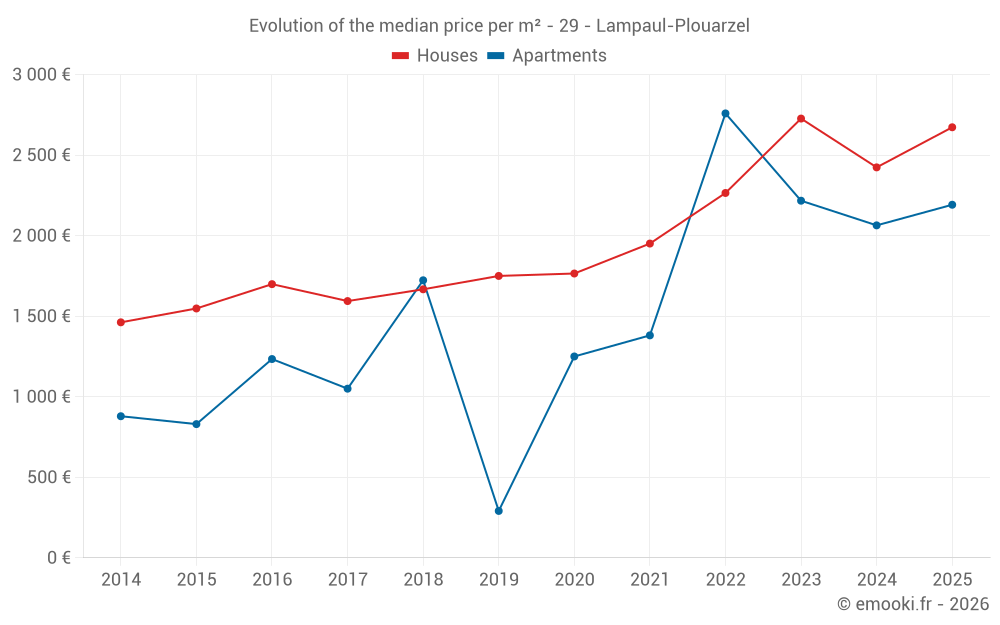
Median price of real estate
in the municipality of Lampaul-Plouarzel

HousesHouses
2 465  /m²
1-23-45-67-89-10
Reliability 8/10
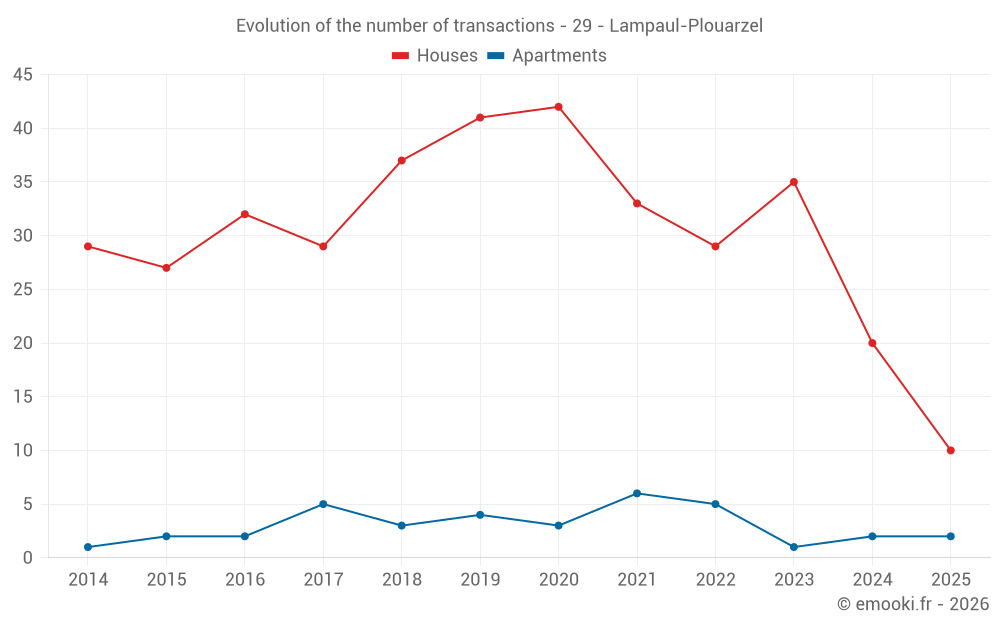
Median price on the 22 transactions of the last 12 months.
from 1 744 to
3 298  /m²
60% of transactions from the 2nd to the 8th deciles.
ApartmentsApartments
2 030  /m²
1-23-45-67-89-10
Reliability 5/10
Median price on the 12 transactions of the last 48 months.
from 1 494 to
2 873  /m²
60% of transactions from the 2nd to the 8th deciles.
DwellingsDwellings
2 427  /m²
1-23-45-67-89-10
Reliability 8/10
Median price on the 25 transactions of the last 12 months.
from 1 704 to
3 002  /m²
60% of transactions from the 2nd to the 8th deciles.
HousesEvolution of the price per m² of houses since...
1 year
+10%
2 years
-2%
3 years
+18%
4 years
+37%
5 years
+51%
6 years
+53%
7 years
+60%
8 years
+68%
9 years
+57%
10 years
+73%
11 years
+83%
The price per m² of houses has decreased by 2% since 2 years, but it has increased by 83% in 11 years.

Yearly evolution

Evolution of the median price per m²

Evolution of the median price per m² - 29 - Lampaul-Plouarzel

Evolution of the number of transactions

Warning, last year incomplete. Projections made based on the proportions between semesters of the previous year at the departmental/national level and by type of property.

Evolution of the number of transactions - 29 - Lampaul-Plouarzel

Yearly data

Descending order
Year
Houses
house
transactions
Houses
house
Price per m²
Apartments
apt.
transactions
Apartments
apt.
Price per m²
2025
10
2 673 
2
2 192 
2024
20
2 424 
2
2 064 
2023
35
2 727 
1
2 217 
2022
29
2 265 
5
2 759 
2021
33
1 951 
6
1 381 
2020
42
1 765 
3
1 250 
2019
41
1 750 
4
291 
2018
37
1 667 
3
1 723 
2017
29
1 594 
5
1 050 
2016
32
1 699 
2
1 234 
2015
27
1 548 
2
830 
2014
29
1 462 
1
879 

Analysis

Structure of prices per m²

Values of price percentiles per m² over the periods used for the estimated price of each type of property.

Structure of transaction amounts

Values of transaction amounts percentiles over the periods used for the estimated price of each type of property.

Transaction amounts and prices per m² by percentile

Ascending order
Percentile
Houses
house
Price per m²
Houses
house
Transaction amount
Apartments
apt.
Price per m²
Apartments
apt.
Transaction amount
10th percentile
1 525 
110 K
1 321 
69 650 
20th percentile
1 744 
135 K
1 494 
80 000 
30th percentile
1 954 
161 K
1 566 
82 730 
40th percentile
2 336 
182 K
1 716 
89 460 
50th percentile
2 465 
206 K
2 030 
96 000 
60th percentile
2 580 
222 K
2 258 
112 K
70th percentile
2 731 
239 K
2 617 
141 K
80th percentile
3 298 
274 K
2 873 
157 K
90th percentile
3 666 
278 K
3 083 
179 K

National and departmental comparison

Evolution of the median price per m² of houses

Evolution of the median price per m² of apartments

Quarterly evolution

Evolution of the median price per m²

Evolution of the number of transactions

Quarterly data

Descending order
Quarter
Houses
house
transactions
Houses
house
Price per m²
Apartments
apt.
transactions
Apartments
apt.
Price per m²
2025 Q2
4
2 673 
1
2 902 
2025 Q1
6
2 584 
1
1 483 
2024 Q4
4
2 278 
1
2 285 
2024 Q3
8
2 424 
0
--- 
2024 Q2
6
2 455 
1
1 844 
2024 Q1
2
2 229 
0
--- 
2023 Q4
7
2 950 
0
--- 
2023 Q3
13
2 356 
1
2 217 
2023 Q2
8
2 328 
0
--- 
2023 Q1
7
2 778 
0
--- 
2022 Q4
6
2 572 
0
--- 
2022 Q3
7
2 394 
2
2 372 
2022 Q2
6
2 181 
2
2 021 
2022 Q1
10
2 226 
1
3 103 
2021 Q4
10
2 264 
1
1 538 
2021 Q3
12
1 964 
1
1 303 
2021 Q2
5
1 605 
3
1 459 
2021 Q1
6
1 838 
1
571 
2020 Q4
9
1 696 
2
2 034 
2020 Q3
14
1 968 
0
--- 
2020 Q2
6
1 945 
0
--- 
2020 Q1
13
1 636 
1
714 
2019 Q4
13
1 774 
1
71 
2019 Q3
11
1 474 
1
667 
2019 Q2
6
1 883 
1
506 
2019 Q1
11
1 750 
1
76 
2018 Q4
11
1 800 
2
1 462 
2018 Q3
8
1 362 
0
--- 
2018 Q2
9
1 652 
1
1 883 
2018 Q1
9
1 714 
0
--- 
2017 Q4
6
1 862 
2
822 
2017 Q3
5
1 409 
3
1 050 
2017 Q2
8
1 462 
0
--- 
2017 Q1
10
1 828 
0
--- 
2016 Q4
7
2 152 
0
--- 
2016 Q3
8
1 566 
0
--- 
2016 Q2
13
1 686 
0
--- 
2016 Q1
4
1 636 
2
1 234 
2015 Q4
9
1 511 
1
976 
2015 Q3
5
1 482 
0
--- 
2015 Q2
8
1 578 
1
685 
2015 Q1
5
1 850 
0
--- 
2014 Q4
8
1 347 
0
--- 
2014 Q3
9
1 439 
0
--- 
2014 Q2
8
1 850 
1
879 
2014 Q1
4
1 312 
0
--- 

Overview of the latest real estate transactions

The following list is an anonymized overview of the latest transactions. For more details and to find all transactions, please use the map to view transactions by plot or the transaction search page for a search by criteria.

2025-06-12
238 000 
3 400  /m²(70 m²)
Sale
Houses
House
4 rooms
70 m2
1 outbuilding
Land
305 m2
-Sols
Land
982 m2
-Terres
Land
61 m2
-Terres
2025-05-09
390 000 
2 583  /m²(151 m²)
Sale
Houses
House
6 rooms
151 m2
1 outbuilding
Land
687 m2
-Sols
Land
174 m2
-Sols
Land
85 m2
-Sols
Land
310 m2
-Terres
2025-04-26
119 000 
2 902  /m²(41 m²)
Sale
Apartments
Apartment
1 room
41 m2
1 outbuilding
2025-04-18
105 000 
2 763  /m²(38 m²)
Sale
Houses
House
1 room
38 m2
Land
186 m2
-Sols
Land
215 m2
-Jardins
Land
251 m2
-Jardins
Land
117 m2
-Sols
Land
14 m2
-Sols
2025-04-09
40 000 
Sale
Land
730 m2
-Terres
2025-04-08
156 879 
1 705  /m²(92 m²)
Sale
Houses
House
4 rooms
92 m2
1 outbuilding
Land
195 m2
-Sols
2025-04-05
10 000 
Sale
Land
19 m2
-Sols
Land
281 m2
-Jardins
2025-03-29
207 400 
1 938  /m²(107 m²)
Sale
Houses
House
5 rooms
107 m2
Land
937 m2
-Jardins
Land
500 m2
-Sols
2025-02-24
55 000 
Sale
Land
801 m2
-Terrains à bâtir
2025-02-24
278 000 
4 964  /m²(56 m²)
Sale
Houses
House
2 rooms
56 m2
Land
985 m2
-Sols
2025-02-14
1 500 
Sale
Land
2747 m2
-Terres
Land
1196 m2
-Landes
2025-02-14
130 000 
2 889  /m²(45 m²)
Sale
Houses
House
4 rooms
45 m2
Land
720 m2
-Terrains d'agrément
Land
500 m2
-Sols
Land
90 m2
-Terrains d'agrément
2025-02-07
85 000 
Sale
Land
20 m2
-Sols
Land
19 m2
-Sols
Land
587 m2
-Sols
Land
12 m2
-Sols
Land
3 m2
-Sols
2025-02-01
180 900 
1 483  /m²(122 m²)
Sale
Apartments
Apartment
3 rooms
122 m2
2025-01-28
108 816 
1 265  /m²(86 m²)
Sale
Houses
House
4 rooms
86 m2
Land
863 m2
-Sols
2025-01-14
240 000 
3 529  /m²(68 m²)
Sale
Houses
House
5 rooms
68 m2
Land
795 m2
-Sols
2025-01-10
100 
Sale
Land
24 m2
-Sols
2025-01-10
80 000 
Sale
Land
514 m2
-Sols
2025-01-09
278 000 
2 279  /m²(122 m²)
Sale
Houses
House
5 rooms
122 m2
Land
771 m2
-Sols
2024-12-19
7 760 
Sale
Land
485 m2
-Terres
631 transactions listed in the municipality

Finistère (29)

Most expensive cities

City
name
Descending orderHouses
house
Price per m²
3 989 
3 766 
3 461 
3 428 
3 146 
3 102 
3 044 
2 965 
City
name
Descending orderApartments
apt.
Price per m²
4 592 
4 260 
4 097 
3 933 
3 778 
3 210 
3 200 
3 066 

Least expensive cities

City
name
Ascending orderHouses
house
Price per m²
750 
792 
793 
830 
878 
889 
934 
935 
943 
City
name
Ascending orderApartments
apt.
Price per m²
200 
232 
312 
320 
339 
365 
388 
399 
415