emooki
HomePrice mapTransactions
🇬🇧 English🇫🇷 Français🇩🇪 Deutsch🇪🇸 Español🇮🇹 Italiano

Real estate price map


Real estate price map in the municipality of Guissény.

Finistère (29)
Guissény

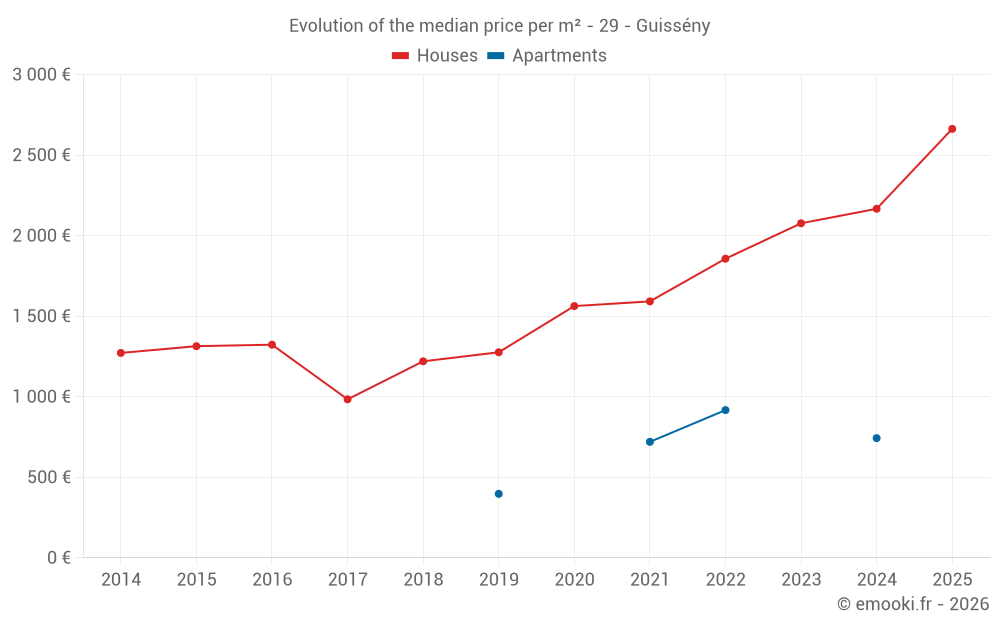
Median price of real estate
in the municipality of Guissény

HousesHouses
2 594  /m²
1-23-45-67-89-10
Reliability 8/10
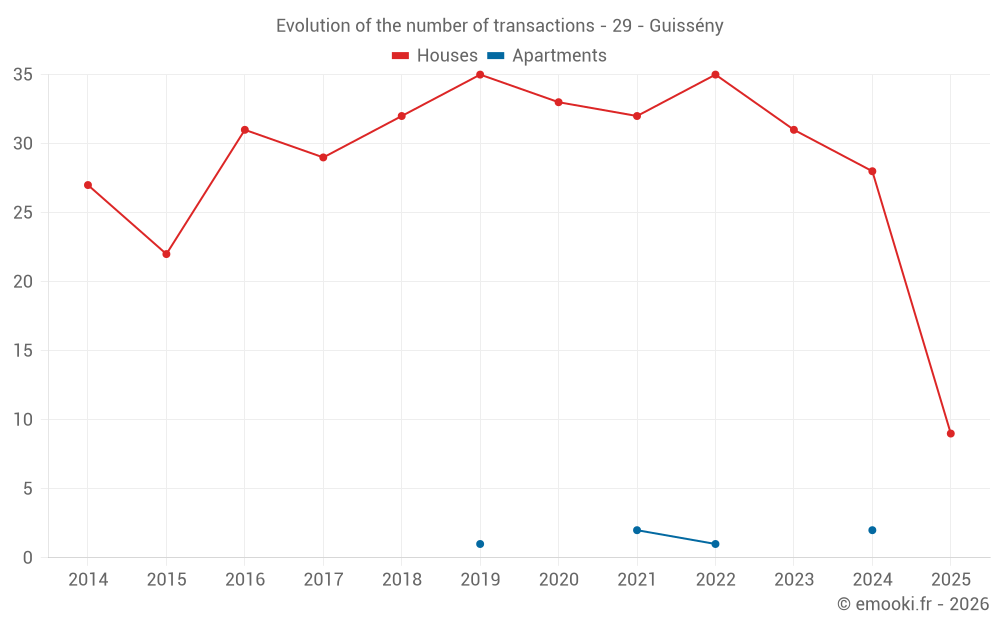
Median price on the 30 transactions of the last 12 months.
from 1 603 to
3 105  /m²
60% of transactions from the 2nd to the 8th deciles.
ApartmentsApartments
657  /m²
1-23-45-67-89-10
Reliability 2/10
Median price on the 6 transactions of the last 96 months.
DwellingsDwellings
2 492  /m²
1-23-45-67-89-10
Reliability 8/10
Median price on the 32 transactions of the last 12 months.
from 1 278 to
3 058  /m²
60% of transactions from the 2nd to the 8th deciles.
HousesEvolution of the price per m² of houses since...
1 year
+23%
2 years
+28%
3 years
+43%
4 years
+67%
5 years
+70%
6 years
+109%
7 years
+118%
8 years
+171%
9 years
+101%
10 years
+103%
11 years
+109%
ApartmentsEvolution of the price per m² of apartments since...
1 year
--
2 years
--
3 years
--
4 years
--
5 years
--
6 years
--
7 years
--
8 years
--
9 years
--
10 years
--
11 years
--

Yearly evolution

Evolution of the median price per m²

Evolution of the number of transactions

Warning, last year incomplete. Projections made based on the proportions between semesters of the previous year at the departmental/national level and by type of property.

Yearly data

Descending order
Year
Houses
house
transactions
Houses
house
Price per m²
Apartments
apt.
transactions
Apartments
apt.
Price per m²
2025
9
2 663 
0
--- 
2024
28
2 167 
2
743 
2023
31
2 077 
0
--- 
2022
35
1 857 
1
917 
2021
32
1 592 
2
720 
2020
33
1 563 
0
--- 
2019
35
1 276 
1
397 
2018
32
1 220 
0
--- 
2017
29
984 
0
--- 
2016
31
1 323 
0
--- 
2015
22
1 314 
0
--- 
2014
27
1 272 
0
--- 

Analysis

Structure of prices per m²

Values of price percentiles per m² over the periods used for the estimated price of each type of property.

Structure of transaction amounts

Values of transaction amounts percentiles over the periods used for the estimated price of each type of property.

Transaction amounts and prices per m² by percentile

Ascending order
Percentile
Houses
house
Price per m²
Houses
house
Transaction amount
Apartments
apt.
Price per m²
Apartments
apt.
Transaction amount
10th percentile
1 136 
106 K
342 
60 000 
20th percentile
1 603 
158 K
361 
70 000 
30th percentile
1 766 
191 K
379 
72 500 
40th percentile
2 360 
212 K
397 
75 000 
50th percentile
2 594 
246 K
657 
106 K
60th percentile
2 716 
268 K
917 
138 K
70th percentile
2 810 
286 K
998 
144 K
80th percentile
3 105 
345 K
1 078 
150 K
90th percentile
3 332 
373 K
1 120 
185 K

National and departmental comparison

Evolution of the median price per m² of houses

Evolution of the median price per m² of apartments

Quarterly evolution

Evolution of the median price per m²

Evolution of the number of transactions

Quarterly data

Descending order
Quarter
Houses
house
transactions
Houses
house
Price per m²
Apartments
apt.
transactions
Apartments
apt.
Price per m²
2025 Q2
2
2 194 
0
--- 
2025 Q1
7
2 663 
0
--- 
2024 Q4
9
1 700 
0
--- 
2024 Q3
12
2 818 
2
743 
2024 Q2
3
1 143 
0
--- 
2024 Q1
4
1 656 
0
--- 
2023 Q4
8
1 782 
0
--- 
2023 Q3
6
1 872 
0
--- 
2023 Q2
11
2 237 
0
--- 
2023 Q1
6
2 330 
0
--- 
2022 Q4
10
2 200 
0
--- 
2022 Q3
9
2 179 
1
917 
2022 Q2
10
1 709 
0
--- 
2022 Q1
6
1 579 
0
--- 
2021 Q4
10
1 260 
0
--- 
2021 Q3
9
2 269 
0
--- 
2021 Q2
5
1 547 
1
361 
2021 Q1
8
1 912 
1
1 078 
2020 Q4
15
1 563 
0
--- 
2020 Q3
5
1 728 
0
--- 
2020 Q2
8
1 282 
0
--- 
2020 Q1
5
1 632 
0
--- 
2019 Q4
11
1 218 
0
--- 
2019 Q3
9
1 139 
0
--- 
2019 Q2
11
1 500 
0
--- 
2019 Q1
4
840 
1
397 
2018 Q4
10
1 510 
0
--- 
2018 Q3
11
1 111 
0
--- 
2018 Q2
6
1 220 
0
--- 
2018 Q1
5
1 421 
0
--- 
2017 Q4
6
956 
0
--- 
2017 Q3
6
1 262 
0
--- 
2017 Q2
10
1 034 
0
--- 
2017 Q1
7
785 
0
--- 
2016 Q4
10
1 444 
0
--- 
2016 Q3
8
1 022 
0
--- 
2016 Q2
4
1 602 
0
--- 
2016 Q1
9
1 162 
0
--- 
2015 Q4
7
1 563 
0
--- 
2015 Q3
4
1 753 
0
--- 
2015 Q2
5
1 118 
0
--- 
2015 Q1
6
1 094 
0
--- 
2014 Q4
9
1 244 
0
--- 
2014 Q3
7
1 485 
0
--- 
2014 Q2
8
1 335 
0
--- 
2014 Q1
3
1 119 
0
--- 

Finistère (29)

Most expensive cities

City
name
Descending orderHouses
house
Price per m²
3 989 
3 766 
3 461 
3 428 
3 146 
3 102 
3 044 
2 965 
City
name
Descending orderApartments
apt.
Price per m²
4 592 
4 260 
4 097 
3 933 
3 778 
3 210 
3 200 
3 066 

Least expensive cities

City
name
Ascending orderHouses
house
Price per m²
750 
792 
793 
830 
878 
889 
934 
935 
943 
City
name
Ascending orderApartments
apt.
Price per m²
200 
232 
312 
320 
339 
365 
388 
399 
415