emooki
HomePrice mapTransactions
🇬🇧 English🇫🇷 Français🇩🇪 Deutsch🇪🇸 Español🇮🇹 Italiano

Real estate price map


Real estate price map in the municipality of Brest, choose a section to see transactions by parcel.

Finistère (29)

Brest - Real estate price m²

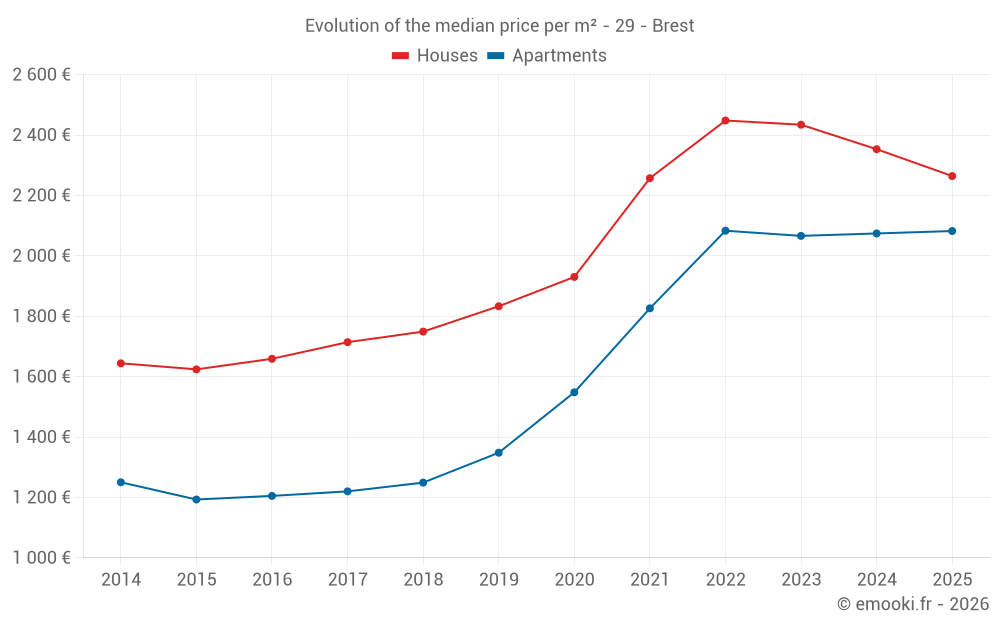
Median price of real estate
in the municipality of Brest

HousesHouses
2 264  /m²
1-23-45-67-89-10
Reliability 10/10
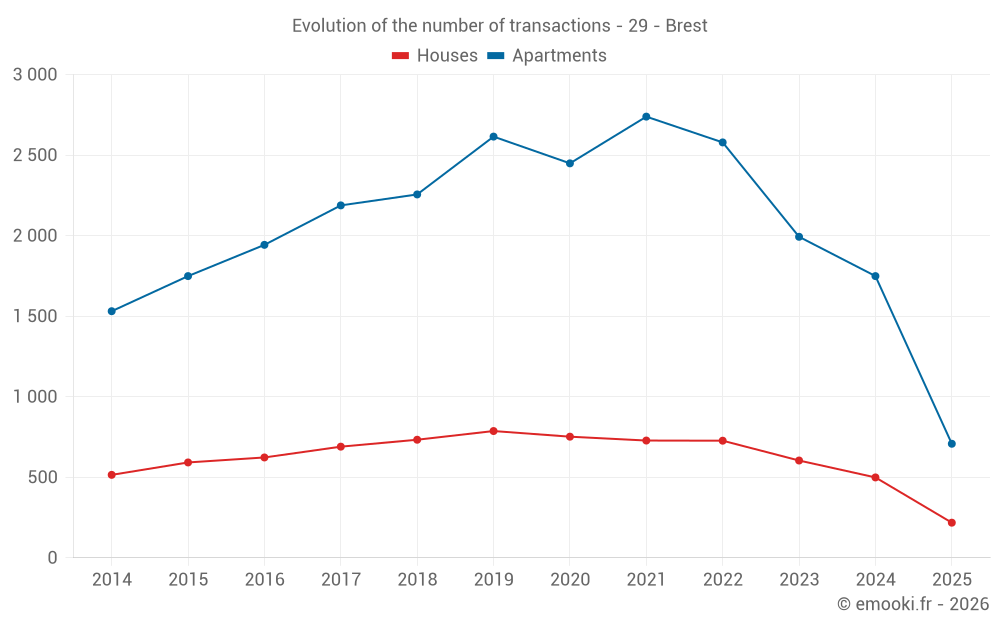
Median price on the 82 transactions of the last 3 months.
from 1 870 to
2 954  /m²
60% of transactions from the 2nd to the 8th deciles.
ApartmentsApartments
2 118  /m²
1-23-45-67-89-10
Reliability 10/10
Median price on the 275 transactions of the last 3 months.
from 1 678 to
2 821  /m²
60% of transactions from the 2nd to the 8th deciles.
DwellingsDwellings
2 163  /m²
1-23-45-67-89-10
Reliability 10/10
Median price on the 357 transactions of the last 3 months.
from 1 716 to
2 833  /m²
60% of transactions from the 2nd to the 8th deciles.
HousesEvolution of the price per m² of houses since...
1 year
-3.8%
2 years
-7%
3 years
-7.5%
4 years
+0.3%
5 years
+17%
6 years
+24%
7 years
+29%
8 years
+32%
9 years
+36%
10 years
+39%
11 years
+38%
The price per m² of houses has decreased by 7.5% since 3 years, but it has increased by 39% in 10 years.
ApartmentsEvolution of the price per m² of apartments since...
1 year
+0.4%
2 years
+0.8%
3 years
0%
4 years
+14%
5 years
+34%
6 years
+54%
7 years
+67%
8 years
+71%
9 years
+73%
10 years
+75%
11 years
+67%

Yearly evolution

Evolution of the median price per m²

Evolution of the median price per m² - 29 - Brest

Evolution of the number of transactions

Warning, last year incomplete. Projections made based on the proportions between semesters of the previous year at the departmental/national level and by type of property.

Evolution of the number of transactions - 29 - Brest

Yearly data

Descending order
Year
Houses
house
transactions
Houses
house
Price per m²
Apartments
apt.
transactions
Apartments
apt.
Price per m²
2025
218
2 264 
708
2 082 
2024
499
2 353 
1 749
2 074 
2023
604
2 434 
1 993
2 066 
2022
727
2 448 
2 579
2 083 
2021
728
2 257 
2 739
1 826 
2020
752
1 930 
2 449
1 548 
2019
787
1 833 
2 615
1 348 
2018
733
1 749 
2 256
1 249 
2017
690
1 714 
2 188
1 220 
2016
623
1 659 
1 943
1 205 
2015
592
1 624 
1 749
1 193 
2014
515
1 644 
1 531
1 250 

Analysis

Structure of prices per m²

Values of price percentiles per m² over the periods used for the estimated price of each type of property.

Structure of transaction amounts

Values of transaction amounts percentiles over the periods used for the estimated price of each type of property.

Transaction amounts and prices per m² by percentile

Ascending order
Percentile
Houses
house
Price per m²
Houses
house
Transaction amount
Apartments
apt.
Price per m²
Apartments
apt.
Transaction amount
10th percentile
1 626 
140 K
1 452 
72 000 
20th percentile
1 870 
171 K
1 678 
90 000 
30th percentile
1 990 
197 K
1 866 
104 K
40th percentile
2 147 
210 K
1 968 
112 K
50th percentile
2 264 
231 K
2 118 
122 K
60th percentile
2 472 
247 K
2 326 
130 K
70th percentile
2 757 
251 K
2 562 
141 K
80th percentile
2 954 
293 K
2 821 
163 K
90th percentile
3 250 
345 K
3 124 
204 K

National and departmental comparison

Evolution of the median price per m² of houses

Evolution of the median price per m² of apartments

Quarterly evolution

Evolution of the median price per m²

Evolution of the number of transactions

Quarterly data

Descending order
Quarter
Houses
house
transactions
Houses
house
Price per m²
Apartments
apt.
transactions
Apartments
apt.
Price per m²
2025 Q2
82
2 264 
275
2 118 
2025 Q1
136
2 252 
433
2 065 
2024 Q4
130
2 354 
453
2 113 
2024 Q3
155
2 500 
491
2 103 
2024 Q2
114
2 250 
411
2 061 
2024 Q1
100
2 292 
394
2 043 
2023 Q4
116
2 286 
463
2 032 
2023 Q3
186
2 424 
540
2 070 
2023 Q2
168
2 632 
512
2 054 
2023 Q1
134
2 414 
478
2 099 
2022 Q4
152
2 541 
585
2 123 
2022 Q3
225
2 500 
688
2 154 
2022 Q2
194
2 388 
655
2 061 
2022 Q1
156
2 325 
651
2 000 
2021 Q4
169
2 295 
651
1 923 
2021 Q3
235
2 331 
807
1 857 
2021 Q2
191
2 172 
696
1 796 
2021 Q1
133
2 219 
585
1 674 
2020 Q4
237
1 944 
723
1 637 
2020 Q3
195
2 019 
634
1 590 
2020 Q2
176
1 944 
543
1 490 
2020 Q1
144
1 814 
549
1 444 
2019 Q4
196
1 932 
652
1 408 
2019 Q3
232
1 882 
763
1 367 
2019 Q2
207
1 765 
605
1 319 
2019 Q1
152
1 637 
595
1 278 
2018 Q4
189
1 774 
562
1 268 
2018 Q3
225
1 778 
642
1 247 
2018 Q2
170
1 692 
528
1 259 
2018 Q1
149
1 754 
524
1 214 
2017 Q4
165
1 732 
512
1 256 
2017 Q3
187
1 721 
588
1 220 
2017 Q2
180
1 722 
593
1 214 
2017 Q1
158
1 671 
495
1 212 
2016 Q4
145
1 667 
488
1 214 
2016 Q3
197
1 745 
545
1 220 
2016 Q2
140
1 610 
491
1 176 
2016 Q1
141
1 627 
419
1 207 
2015 Q4
132
1 614 
457
1 176 
2015 Q3
174
1 670 
496
1 220 
2015 Q2
145
1 623 
473
1 167 
2015 Q1
141
1 540 
323
1 200 
2014 Q4
127
1 638 
368
1 216 
2014 Q3
148
1 626 
385
1 277 
2014 Q2
109
1 688 
398
1 250 
2014 Q1
131
1 625 
380
1 254 

Overview of the latest real estate transactions

The following list is an anonymized overview of the latest transactions. For more details and to find all transactions, please use the map to view transactions by plot or the transaction search page for a search by criteria.

2025-06-24
91 000 
664  /m²(137 m²)
Sale
Commercial property
137 m2
Land
236 m2
-Sols
2025-06-23
160 000 
2 581  /m²(62 m²)
Sale
Apartments
Apartment
2 rooms
62 m2
1 outbuilding
2025-06-16
131 000 
1 899  /m²(69 m²)
Sale
Apartments
Apartment
4 rooms
69 m2
1 outbuilding
1 outbuilding
2025-06-16
65 766 
1 044  /m²(63 m²)
Sale
Apartments
Apartment
4 rooms
63 m2
1 outbuilding
2025-06-11
116 600 
3 068  /m²(38 m²)
Sale
Apartments
Apartment
2 rooms
38 m2
2025-06-11
229 200 
1 028  /m²(223 m²)
Sale
Commercial property
130 m2
Commercial property
93 m2
2025-06-11
163 000 
1 940  /m²(84 m²)
Sale
Apartments
Apartment
4 rooms
84 m2
1 outbuilding
2025-06-10
134 100 
1 412  /m²(95 m²)
Sale
Apartments
Apartment
4 rooms
95 m2
1 outbuilding
2025-06-10
164 000 
1 976  /m²(83 m²)
Sale
Apartments
Apartment
5 rooms
83 m2
1 outbuilding
2025-06-09
53 200 
1 209  /m²(44 m²)
Sale
Apartments
Apartment
2 rooms
44 m2
2025-06-06
74 600 
1 492  /m²(50 m²)
Sale
Apartments
Apartment
2 rooms
50 m2
2 outbuildings
2025-06-06
270 000 
2 411  /m²(112 m²)
Sale
Apartments
Apartment
4 rooms
112 m2
1 outbuilding
2025-06-04
71 500 
3 405  /m²(21 m²)
Sale
Apartments
Apartment
1 room
21 m2
1 outbuilding
2025-06-03
75 000 
3 947  /m²(19 m²)
Sale
Apartments
Apartment
1 room
19 m2
2025-06-03
153 000 
2 732  /m²(56 m²)
Sale
Apartments
Apartment
2 rooms
56 m2
1 outbuilding
2025-06-03
18 000 
Sale
Land
172 m2
-Terres
2025-06-02
52 000 
559  /m²(93 m²)
Sale
Commercial property
93 m2
2025-06-02
127 500 
1 875  /m²(68 m²)
Sale
Apartments
Apartment
2 rooms
68 m2
1 outbuilding
2025-05-30
50 000 
1 250  /m²(40 m²)
Sale
Apartments
Apartment
2 rooms
40 m2
1 outbuilding
2025-05-28
221 000 
2 986  /m²(74 m²)
Sale
Apartments
Apartment
4 rooms
74 m2
40794 transactions listed in the municipality

Finistère (29)

Most expensive cities

City
name
Descending orderHouses
house
Price per m²
3 989 
3 766 
3 461 
3 428 
3 146 
3 102 
3 044 
2 965 
City
name
Descending orderApartments
apt.
Price per m²
4 592 
4 260 
4 097 
3 933 
3 778 
3 210 
3 200 
3 066 

Least expensive cities

City
name
Ascending orderHouses
house
Price per m²
750 
792 
793 
830 
878 
889 
934 
935 
943 
City
name
Ascending orderApartments
apt.
Price per m²
200 
232 
312 
320 
339 
365 
388 
399 
415