Real estate price map
Real estate price map in the municipality of Voillans, choose a section to see transactions by parcel.
Doubs (25)
Price per m² in Voillans
Median price of real estate
in the municipality of Voillans
Houses
870 € /m²
Reliability 4/10
Median price on the 8 transactions of the last 60 months.
Apartments
1 406 € /m²
Reliability 1/10
Price of the unique transaction of the last 120 months.
Dwellings
870 € /m²
Reliability 4/10
Median price on the 8 transactions of the last 60 months.
Yearly evolution
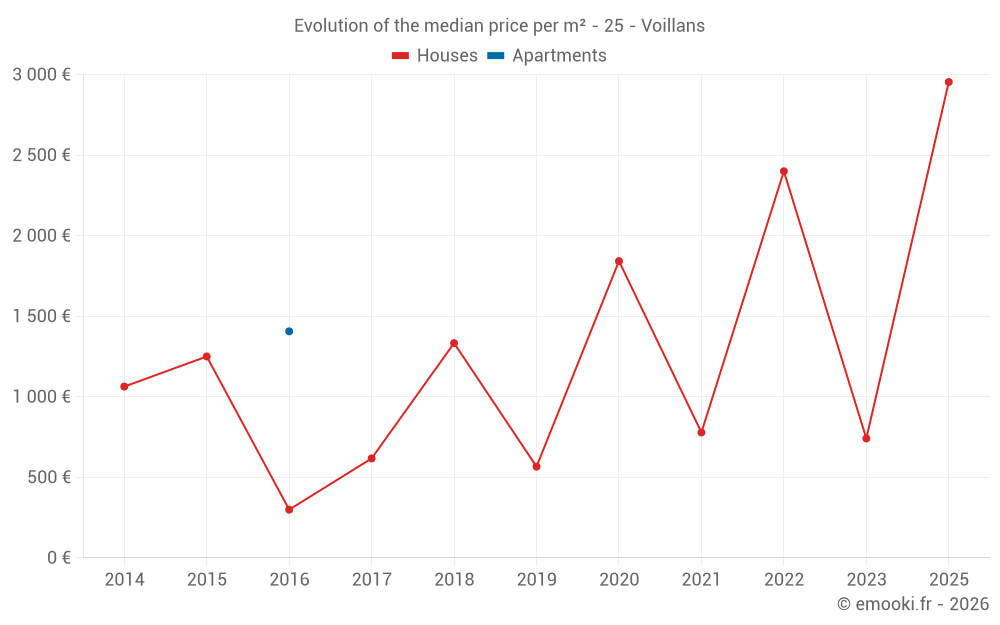
Evolution of the median price per m²
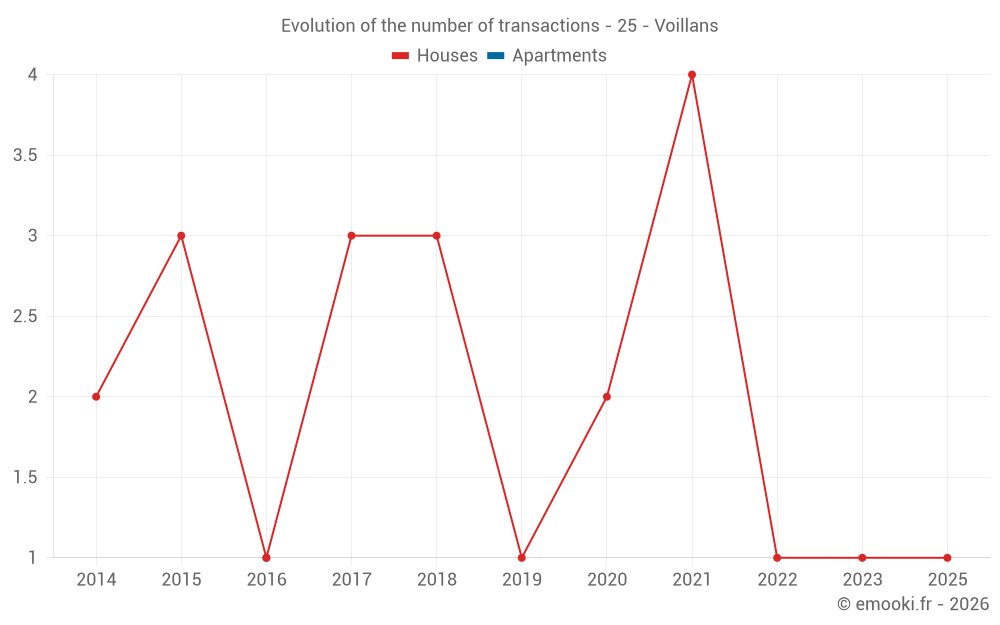
Evolution of the number of transactions
Warning, last year incomplete. Projections made based on the proportions between semesters of the previous year at the departmental/national level and by type of property.
Yearly data
Year
house
transactions
transactions
house
Price per m²
Price per m²
apt.
transactions
transactions
apt.
Price per m²
Price per m²
2025
1
2 954 €
0
--- €
2024
0
--- €
0
--- €
2023
1
741 €
0
--- €
2022
1
2 400 €
0
--- €
2021
4
778 €
0
--- €
2020
2
1 842 €
0
--- €
2019
1
566 €
0
--- €
2018
3
1 333 €
0
--- €
2017
3
617 €
0
--- €
2016
1
299 €
1
1 406 €
2015
3
1 250 €
0
--- €
2014
2
1 063 €
0
--- €
Analysis
Structure of prices per m²
Values of price percentiles per m² over the periods used for the estimated price of each type of property.
Structure of transaction amounts
Values of transaction amounts percentiles over the periods used for the estimated price of each type of property.
Transaction amounts and prices per m² by percentile
Percentile
house
Price per m²
Price per m²
house
Transaction amount
Transaction amount
apt.
Price per m²
Price per m²
apt.
Transaction amount
Transaction amount
10th percentile
401 €
35 850 €
1 406 €
135 K€
20th percentile
464 €
38 500 €
1 406 €
135 K€
30th percentile
574 €
42 300 €
1 406 €
135 K€
40th percentile
704 €
58 400 €
1 406 €
135 K€
50th percentile
870 €
74 000 €
1 406 €
135 K€
60th percentile
1 139 €
103 K€
1 406 €
135 K€
70th percentile
1 626 €
164 K€
1 406 €
135 K€
80th percentile
2 118 €
213 K€
1 406 €
135 K€
90th percentile
2 566 €
257 K€
1 406 €
135 K€
National and departmental comparison
Evolution of the median price per m² of houses
Evolution of the median price per m² of apartments
Quarterly evolution
Evolution of the median price per m²
Evolution of the number of transactions
Quarterly data
Quarter
house
transactions
transactions
house
Price per m²
Price per m²
apt.
transactions
transactions
apt.
Price per m²
Price per m²
2025 Q1
1
2 954 €
0
--- €
2023 Q4
1
741 €
0
--- €
2022 Q1
1
2 400 €
0
--- €
2021 Q4
2
778 €
0
--- €
2021 Q2
1
1 696 €
0
--- €
2021 Q1
1
395 €
0
--- €
2020 Q3
1
403 €
0
--- €
2020 Q2
1
3 282 €
0
--- €
2019 Q2
1
566 €
0
--- €
2018 Q3
1
1 333 €
0
--- €
2018 Q2
2
1 382 €
0
--- €
2017 Q3
1
617 €
0
--- €
2017 Q2
1
941 €
0
--- €
2017 Q1
1
514 €
0
--- €
2016 Q4
0
--- €
1
1 406 €
2016 Q2
1
299 €
0
--- €
2015 Q4
1
765 €
0
--- €
2015 Q3
2
1 265 €
0
--- €
2014 Q2
1
1 083 €
0
--- €
2014 Q1
1
1 043 €
0
--- €
Overview of the latest real estate transactions
The following list is an anonymized overview of the latest transactions. For more details and to find all transactions, please use the map to view transactions by plot or the transaction search page for a search by criteria.
2025-06-24
1 150 €Sale
Land
115 m2
-Sols
2025-01-21
295 400 €2 954 € /m²(100 m²)
Sale
House
3 rooms
100 m2
Land
1924 m2
-Sols
Land
1000 m2
-Sols
Land
9048 m2
-Terres
2024-08-19
6 730 €Sale
Land
7100 m2
-Prés
Land
8950 m2
-Prés
Land
1920 m2
-Taillis simples
2024-04-15
33 123 €Sale
Land
23624 m2
-Prés
Land
1440 m2
-Taillis simples
Land
15210 m2
-Terres
Land
2160 m2
-Taillis simples
Land
47246 m2
-Prés
Land
1720 m2
-Taillis simples
Land
2240 m2
-Terres
Land
19290 m2
-Landes
/Friche
Land
1440 m2
-Landes
/Friche
Land
4600 m2
-Taillis simples
Land
6760 m2
-Prés
2024-04-15
14 780 €Sale
Land
36067 m2
-Prés
Land
22645 m2
-Terres
Land
406 m2
-Jardins
2023-11-30
63 000 €741 € /m²(85 m²)
Sale
House
3 rooms
85 m2
Land
950 m2
-Sols
2023-07-18
23 043 €Sale
Land
12000 m2
-Taillis simples
Land
8640 m2
-Prés
Land
3320 m2
-Taillis simples
Land
8680 m2
-Taillis simples
Land
3040 m2
-Taillis simples
Land
3600 m2
-Taillis simples
Land
41570 m2
-Prés
Land
1960 m2
-Landes
/Friche
2023-02-28
890 €Sale
Land
178 m2
-Landes
/Friche
2022-12-20
5 000 €Sale
Land
10824 m2
-Taillis sous futaie
2022-11-28
500 €Sale
Land
520 m2
-Prés
Land
920 m2
-Taillis simples
Land
1720 m2
-Prés
Land
5610 m2
-Taillis simples
2022-06-21
450 €Sale
Land
2150 m2
-Futaies résineuses
/EPICE
2022-05-31
23 500 €Sale
Land
815 m2
-Prés
2022-05-05
175 000 €Sale
Land
40820 m2
-Futaies résineuses
/EPICE
Land
40820 m2
-Taillis simples
Land
10420 m2
-Futaies résineuses
/EPICE
Land
4183 m2
-Terres
Land
3840 m2
-Taillis sous futaie
Land
8340 m2
-Futaies résineuses
/EPICE
Land
16733 m2
-Terres
Land
81072 m2
-Taillis sous futaie
2022-03-29
7 942 €Sale
Land
21130 m2
-Prés
Land
6660 m2
-Taillis simples
Land
5165 m2
-Terres
Land
6000 m2
-Prés
2022-01-31
240 000 €2 400 € /m²(100 m²)
Sale
House
3 rooms
100 m2
Land
704 m2
-Sols
2021-12-01
85 000 €556 € /m²(153 m²)
Sale
House
5 rooms
153 m2
Land
132 m2
-Sols
Land
275 m2
-Jardins
2021-11-05
40 000 €1 000 € /m²(40 m²)
Sale
House
3 rooms
40 m2
1 outbuilding
Land
680 m2
-Sols
Land
42 m2
-Sols
2021-07-27
1 500 €Sale
Land
2175 m2
-Prés
Land
2988 m2
-Taillis simples
2021-04-28
173 000 €1 696 € /m²(102 m²)
Sale
House
5 rooms
102 m2
Land
700 m2
-Sols
Land
914 m2
-Prés
2021-03-08
32 000 €395 € /m²(81 m²)
Sale
House
2 rooms
81 m2
Land
404 m2
-Sols
Land
283 m2
-Jardins
Land
105 m2
-Sols
69 transactions listed in the municipality
Compare with neighboring municipalities
City
name
name
house
Price per m²
Price per m²
apt.
Price per m²
Price per m²
City information
Zip code
- 25110 VOILLANS
Data source & update
- Latest publication of the property value request (DVF) database made available by the DGFiP on October 19, 2025, covering transactions up to 06/30/2025:
- Administrative/cadastral division as of September 1, 2025, and municipal movements as of January 1, 2025: