emooki
HomePrice mapTransactions
🇬🇧 English🇫🇷 Français🇩🇪 Deutsch🇪🇸 Español🇮🇹 Italiano

Real estate price map


Real estate price map in the municipality of Malbuisson, choose a section to see transactions by parcel.

Doubs (25)

Malbuisson - Real estate price m²

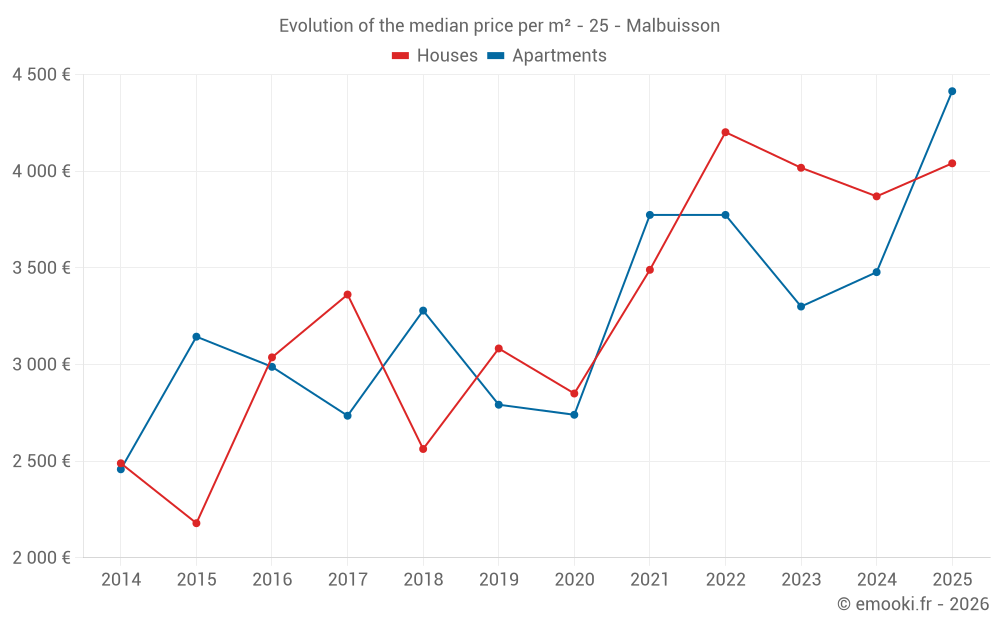
Median price of real estate
in the municipality of Malbuisson

HousesHouses
4 041  /m²
1-23-45-67-89-10
Reliability 6/10
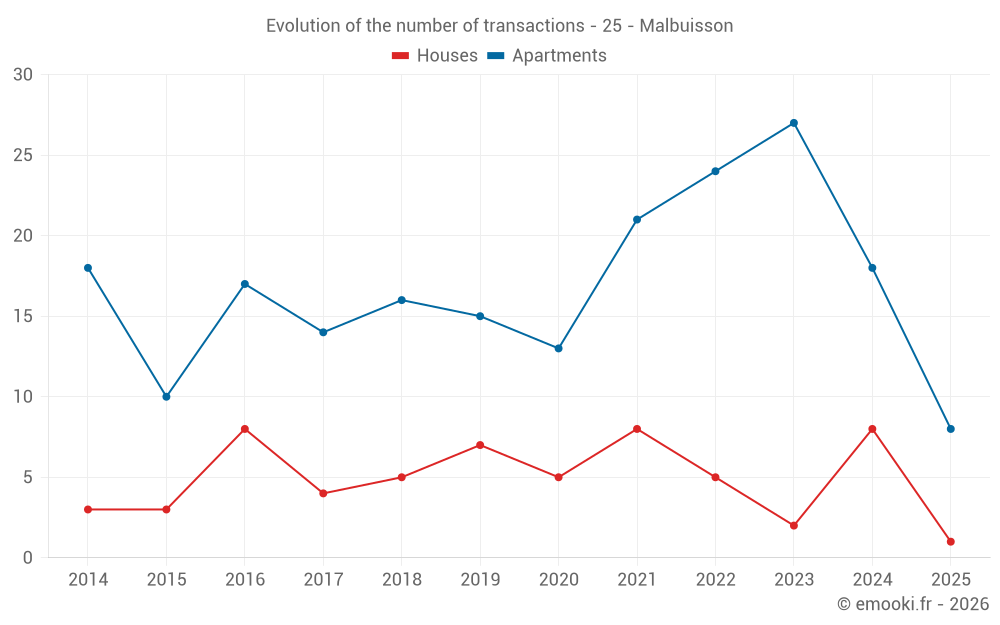
Median price on the 15 transactions of the last 36 months.
from 2 466 to
4 399  /m²
60% of transactions from the 2nd to the 8th deciles.
ApartmentsApartments
3 578  /m²
1-23-45-67-89-10
Reliability 8/10
Median price on the 22 transactions of the last 12 months.
from 2 900 to
4 554  /m²
60% of transactions from the 2nd to the 8th deciles.
DwellingsDwellings
3 656  /m²
1-23-45-67-89-10
Reliability 8/10
Median price on the 25 transactions of the last 12 months.
from 2 884 to
4 487  /m²
60% of transactions from the 2nd to the 8th deciles.
ApartmentsEvolution of the price per m² of apartments since...
1 year
+27%
2 years
+34%
3 years
+17%
4 years
+17%
5 years
+61%
6 years
+58%
7 years
+35%
8 years
+61%
9 years
+48%
10 years
+40%
11 years
+80%

Yearly evolution

Evolution of the median price per m²

Evolution of the median price per m² - 25 - Malbuisson

Evolution of the number of transactions

Warning, last year incomplete. Projections made based on the proportions between semesters of the previous year at the departmental/national level and by type of property.

Evolution of the number of transactions - 25 - Malbuisson

Yearly data

Descending order
Year
Houses
house
transactions
Houses
house
Price per m²
Apartments
apt.
transactions
Apartments
apt.
Price per m²
2025
1
4 041 
8
4 414 
2024
8
3 870 
18
3 478 
2023
2
4 018 
27
3 300 
2022
5
4 202 
24
3 774 
2021
8
3 490 
21
3 774 
2020
5
2 850 
13
2 740 
2019
7
3 083 
15
2 792 
2018
5
2 563 
16
3 279 
2017
4
3 362 
14
2 735 
2016
8
3 037 
17
2 988 
2015
3
2 179 
10
3 144 
2014
3
2 489 
18
2 458 

Analysis

Structure of prices per m²

Values of price percentiles per m² over the periods used for the estimated price of each type of property.

Structure of transaction amounts

Values of transaction amounts percentiles over the periods used for the estimated price of each type of property.

Transaction amounts and prices per m² by percentile

Ascending order
Percentile
Houses
house
Price per m²
Houses
house
Transaction amount
Apartments
apt.
Price per m²
Apartments
apt.
Transaction amount
10th percentile
1 821 
172 K
2 346 
81 500 
20th percentile
2 466 
270 K
2 900 
97 000 
30th percentile
3 489 
333 K
3 208 
118 K
40th percentile
3 755 
345 K
3 418 
133 K
50th percentile
4 041 
353 K
3 578 
186 K
60th percentile
4 219 
388 K
4 240 
213 K
70th percentile
4 290 
413 K
4 434 
228 K
80th percentile
4 399 
442 K
4 554 
248 K
90th percentile
5 014 
464 K
4 674 
269 K

National and departmental comparison

Evolution of the median price per m² of houses

Evolution of the median price per m² of apartments

Quarterly evolution

Evolution of the median price per m²

Evolution of the number of transactions

Quarterly data

Descending order
Quarter
Houses
house
transactions
Houses
house
Price per m²
Apartments
apt.
transactions
Apartments
apt.
Price per m²
2025 Q2
1
4 041 
3
3 656 
2025 Q1
0
--- 
5
4 464 
2024 Q4
1
4 301 
6
3 209 
2024 Q3
1
1 716 
8
3 446 
2024 Q2
5
4 245 
2
4 670 
2024 Q1
1
1 275 
2
3 580 
2023 Q4
0
--- 
6
3 298 
2023 Q3
2
4 018 
6
2 736 
2023 Q2
0
--- 
7
3 929 
2023 Q1
0
--- 
8
3 491 
2022 Q4
1
3 929 
7
3 701 
2022 Q3
3
4 202 
6
4 042 
2022 Q2
1
4 226 
7
3 214 
2022 Q1
0
--- 
4
4 038 
2021 Q4
1
3 506 
6
3 306 
2021 Q3
3
3 475 
7
3 778 
2021 Q2
2
2 284 
4
3 864 
2021 Q1
2
3 382 
4
4 423 
2020 Q4
1
4 550 
5
2 864 
2020 Q3
3
2 850 
6
2 732 
2020 Q2
1
2 628 
1
3 133 
2020 Q1
0
--- 
1
1 784 
2019 Q4
0
--- 
2
3 448 
2019 Q3
4
2 978 
6
2 702 
2019 Q2
1
3 083 
7
2 792 
2019 Q1
2
3 563 
0
--- 
2018 Q4
0
--- 
4
3 326 
2018 Q3
0
--- 
5
3 277 
2018 Q2
5
2 563 
4
3 452 
2018 Q1
0
--- 
3
3 242 
2017 Q4
1
3 108 
4
2 654 
2017 Q3
1
3 275 
2
3 204 
2017 Q2
1
3 448 
4
2 560 
2017 Q1
1
3 571 
4
2 479 
2016 Q4
2
3 324 
2
3 244 
2016 Q3
2
1 028 
6
3 280 
2016 Q2
4
3 094 
3
3 872 
2016 Q1
0
--- 
6
2 656 
2015 Q4
1
2 179 
3
3 242 
2015 Q3
1
1 935 
3
2 815 
2015 Q2
0
--- 
3
3 036 
2015 Q1
1
3 457 
1
3 517 
2014 Q4
0
--- 
4
2 942 
2014 Q3
1
2 489 
7
2 283 
2014 Q2
2
2 568 
4
2 142 
2014 Q1
0
--- 
3
2 633 

Overview of the latest real estate transactions

The following list is an anonymized overview of the latest transactions. For more details and to find all transactions, please use the map to view transactions by plot or the transaction search page for a search by criteria.

2025-04-25
234 000 
3 656  /m²(64 m²)
Sale
Apartments
Apartment
3 rooms
64 m2
4 outbuildings
2025-04-25
290 000 
4 677  /m²(62 m²)
Sale
Apartments
Apartment
3 rooms
62 m2
1 outbuilding
2025-04-11
472 815 
4 041  /m²(117 m²)
Sale
Houses
House
5 rooms
117 m2
Land
943 m2
-Sols
2025-04-09
600 
Exchange
Land
4 m2
-Sols
2025-04-09
200 
Exchange
Land
2 m2
-Terres
2025-04-02
240 000 
1 200  /m²(200 m²)
Sale
Apartments
Apartment
5 rooms
130 m2
Apartments
Apartment
3 rooms
70 m2
5 outbuildings
Land
222 m2
-Sols
2025-03-28
250 000 
4 464  /m²(56 m²)
Sale
Apartments
Apartment
3 rooms
56 m2
1 outbuilding
2025-02-18
144 000 
4 364  /m²(33 m²)
Sale
Apartments
Apartment
1 room
33 m2
1 outbuilding
2025-02-06
215 000 
2 287  /m²(94 m²)
Sale
Apartments
Apartment
3 rooms
94 m2
1 outbuilding
2025-01-22
119 000 
4 577  /m²(26 m²)
Sale
Apartments
Apartment
1 room
26 m2
1 outbuilding
2025-01-10
210 000 
5 122  /m²(41 m²)
Sale
Apartments
Apartment
2 rooms
41 m2
1 outbuilding
2024-12-30
214 300 
3 456  /m²(62 m²)
Sale
Apartments
Apartment
1 room
31 m2
Apartments
Apartment
1 room
31 m2
2 outbuildings
2024-12-19
77 000 
2 962  /m²(26 m²)
Sale
Apartments
Apartment
1 room
26 m2
1 outbuilding
2024-12-16
400 000 
4 301  /m²(93 m²)
Sale
Houses
House
5 rooms
93 m2
Land
648 m2
-Sols
Land
94 m2
-Prés
2024-12-05
117 500 
2 176  /m²(54 m²)
Sale
Apartments
Apartment
3 rooms
54 m2
1 outbuilding
2024-11-22
253 500 
4 225  /m²(60 m²)
Sale
Apartments
Apartment
3 rooms
60 m2
1 outbuilding
2024-11-08
128 000 
Sale
Land
138 m2
-Sols
Land
398 m2
-Terrains à bâtir
2024-10-28
75 000 
2 885  /m²(26 m²)
Sale
Apartments
Apartment
1 room
26 m2
1 outbuilding
2024-10-07
340 000 
4 250  /m²(80 m²)
Sale
Apartments
Apartment
4 rooms
80 m2
1 outbuilding
2024-09-30
200 000 
4 651  /m²(43 m²)
Sale
Apartments
Apartment
3 rooms
43 m2
1 outbuilding
384 transactions listed in the municipality

Doubs (25)

Most expensive cities

City
name
Descending orderHouses
house
Price per m²
4 618 
4 041 
3 939 
3 768 
3 664 
3 529 
3 455 
City
name
Descending orderApartments
apt.
Price per m²
9 000 
3 578 
3 531 
3 523 
3 317 
3 250 
3 209 
3 192 

Least expensive cities

City
name
Ascending orderHouses
house
Price per m²
322 
356 
419 
464 
535 
602 
608 
City
name
Ascending orderApartments
apt.
Price per m²
86 
119 
134 
179 
184 
184 
228