Real estate price map
Real estate price map in the municipality of Hyèvre-Paroisse, choose a section to see transactions by parcel.
Doubs (25)
Price per m² in Hyèvre-Paroisse
Median price of real estate
in the municipality of Hyèvre-Paroisse
Houses
1 127 € /m²
Reliability 5/10
Median price on the 11 transactions of the last 48 months.
from 265 to
1 354 € /m²
1 354 € /m²
60% of transactions from the 2nd to the 8th deciles.
Apartments
526 € /m²
Reliability 1/10
Price of the unique transaction of the last 120 months.
Dwellings
1 127 € /m²
Reliability 5/10
Median price on the 11 transactions of the last 48 months.
from 265 to
1 354 € /m²
1 354 € /m²
60% of transactions from the 2nd to the 8th deciles.
Yearly evolution
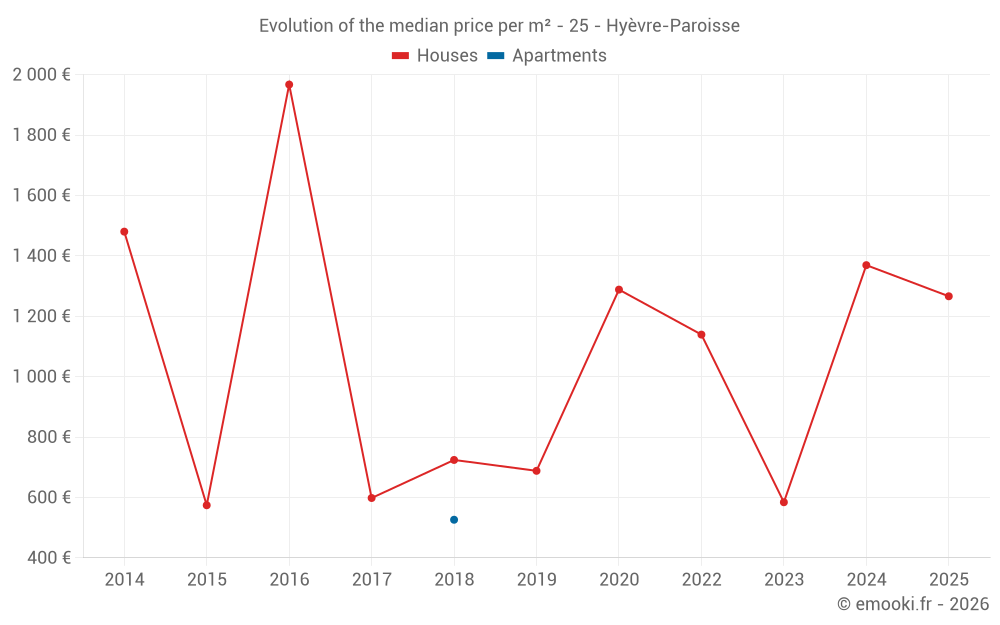
Evolution of the median price per m²
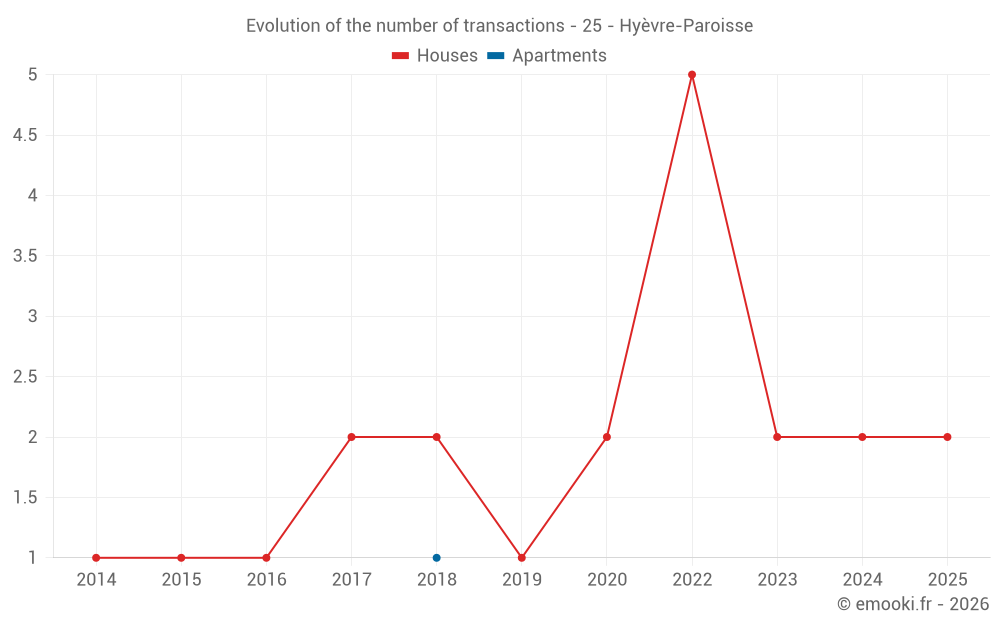
Evolution of the number of transactions
Warning, last year incomplete. Projections made based on the proportions between semesters of the previous year at the departmental/national level and by type of property.
Yearly data
Year
house
transactions
transactions
house
Price per m²
Price per m²
apt.
transactions
transactions
apt.
Price per m²
Price per m²
2025
2
1 266 €
0
--- €
2024
2
1 369 €
0
--- €
2023
2
584 €
0
--- €
2022
5
1 139 €
0
--- €
2021
0
--- €
0
--- €
2020
2
1 288 €
0
--- €
2019
1
688 €
0
--- €
2018
2
724 €
1
526 €
2017
2
598 €
0
--- €
2016
1
1 967 €
0
--- €
2015
1
574 €
0
--- €
2014
1
1 480 €
0
--- €
Analysis
Structure of prices per m²
Values of price percentiles per m² over the periods used for the estimated price of each type of property.
Structure of transaction amounts
Values of transaction amounts percentiles over the periods used for the estimated price of each type of property.
Transaction amounts and prices per m² by percentile
Percentile
house
Price per m²
Price per m²
house
Transaction amount
Transaction amount
apt.
Price per m²
Price per m²
apt.
Transaction amount
Transaction amount
10th percentile
225 €
18 000 €
526 €
60 000 €
20th percentile
265 €
30 000 €
526 €
60 000 €
30th percentile
338 €
49 000 €
526 €
60 000 €
40th percentile
566 €
50 000 €
526 €
60 000 €
50th percentile
1 127 €
52 000 €
526 €
60 000 €
60th percentile
1 139 €
60 000 €
526 €
60 000 €
70th percentile
1 167 €
74 390 €
526 €
60 000 €
80th percentile
1 354 €
88 000 €
526 €
60 000 €
90th percentile
2 308 €
90 000 €
526 €
60 000 €
National and departmental comparison
Evolution of the median price per m² of houses
Evolution of the median price per m² of apartments
Quarterly evolution
Evolution of the median price per m²
Evolution of the number of transactions
Quarterly data
Quarter
house
transactions
transactions
house
Price per m²
Price per m²
apt.
transactions
transactions
apt.
Price per m²
Price per m²
2025 Q2
1
225 €
0
--- €
2025 Q1
1
2 308 €
0
--- €
2024 Q2
1
2 400 €
0
--- €
2024 Q1
1
338 €
0
--- €
2023 Q4
2
584 €
0
--- €
2022 Q4
2
1 260 €
0
--- €
2022 Q2
2
852 €
0
--- €
2022 Q1
1
265 €
0
--- €
2020 Q4
1
1 316 €
0
--- €
2020 Q2
1
1 259 €
0
--- €
2019 Q2
1
688 €
0
--- €
2018 Q4
1
599 €
0
--- €
2018 Q3
1
848 €
0
--- €
2018 Q1
0
--- €
1
526 €
2017 Q4
1
220 €
0
--- €
2017 Q3
1
976 €
0
--- €
2016 Q3
1
1 967 €
0
--- €
2015 Q4
1
574 €
0
--- €
2014 Q4
1
1 480 €
0
--- €
Overview of the latest real estate transactions
The following list is an anonymized overview of the latest transactions. For more details and to find all transactions, please use the map to view transactions by plot or the transaction search page for a search by criteria.
2025-04-18
18 000 €225 € /m²(80 m²)
Sale
House
4 rooms
80 m2
1 outbuilding
Land
367 m2
-Sols
Land
315 m2
-Vergers
2025-03-19
5 000 €Sale
Land
1100 m2
-Prés
2025-03-12
30 000 €2 308 € /m²(13 m²)
Sale
House
13 m2
Land
392 m2
-Sols
Land
368 m2
-Prés
Land
830 m2
-Prés
2025-01-23
7 500 €Sale
Land
349 m2
-Jardins
2024-11-19
7 000 €Sale
Land
15950 m2
-Futaies résineuses
/EPICE
2024-08-29
2 000 €Sale
Land
2130 m2
-Futaies résineuses
/EPICE
2024-06-12
2 000 €Sale
Land
10130 m2
-Taillis sous futaie
2024-04-05
240 000 €2 400 € /m²(100 m²)
Sale
House
5 rooms
100 m2
2 outbuildings
Land
333 m2
-Sols
6 outbuildings
Land
1270 m2
-Vergers
Land
365 m2
-Sols
Land
12 m2
-Sols
Land
330 m2
-Vergers
Land
165 m2
-Sols
Land
170 m2
-Prés
Land
148 m2
-Sols
2024-02-16
2 500 €Sale
Land
120 m2
-Landes
Land
2020 m2
-Prés
Land
1060 m2
-Prés
Land
940 m2
-Taillis simples
Land
4520 m2
-Taillis sous futaie
Land
3520 m2
-Futaies résineuses
/EPICE
2024-01-19
50 000 €338 € /m²(148 m²)
Sale
House
5 rooms
148 m2
Land
1020 m2
-Sols
Land
1230 m2
-Prés
2023-11-06
600 €40 € /m²(15 m²)
Sale
House
1 room
15 m2
Land
394 m2
-Sols
2023-10-09
74 390 €1 127 € /m²(66 m²)
Sale
House
2 rooms
66 m2
Land
537 m2
-Sols
Land
15 m2
-Landes
Land
30 m2
-Jardins
Land
250 m2
-Jardins
Land
145 m2
-Prés
Land
7 m2
-Landes
Land
53 m2
-Landes
Land
350 m2
-Prés
2023-10-03
4 449 €Sale
Land
26100 m2
-Prés
Land
3560 m2
-Taillis sous futaie
2023-05-24
1 000 €Sale
Land
7460 m2
-Taillis sous futaie
2023-05-24
6 500 €Sale
Land
12930 m2
-Taillis sous futaie
Land
6960 m2
-Prés
Land
13310 m2
-Prés
Land
2210 m2
-Taillis sous futaie
2023-05-24
1 200 €Sale
Land
1280 m2
-Taillis simples
Land
4720 m2
-Prés
Land
418 m2
-Taillis simples
2023-05-17
22 422 €Sale
Land
156 m2
-Terrains à bâtir
Land
291 m2
-Terrains à bâtir
Land
92 m2
-Sols
Land
24 m2
-Sols
Land
43 m2
-Terrains à bâtir
2023-04-25
47 720 €Sale
Land
1000 m2
-Prés
2023-04-25
1 000 €Sale
Land
7110 m2
-Taillis sous futaie
2023-04-03
450 €Sale
Land
280 m2
-Prés
60 transactions listed in the municipality
Compare with neighboring municipalities
City
name
name
house
Price per m²
Price per m²
apt.
Price per m²
Price per m²
City information
Zip codes
- 25110 HYEVRE PAROISSE
- BOIS LA VILLE 25110 HYEVRE PAROISSE
Data source & update
- Latest publication of the property value request (DVF) database made available by the DGFiP on October 19, 2025, covering transactions up to 06/30/2025:
- Administrative/cadastral division as of September 1, 2025, and municipal movements as of January 1, 2025: