Real estate price map
Real estate price map in the municipality of Noël-Cerneux, choose a section to see transactions by parcel.
Doubs (25)
Price per m² in Noël-Cerneux
Median price of real estate
in the municipality of Noël-Cerneux
Houses
3 150 € /m²
Reliability 5/10
Median price on the 19 transactions of the last 48 months.
from 2 671 to
3 945 € /m²
3 945 € /m²
60% of transactions from the 2nd to the 8th deciles.
Apartments
1 509 € /m²
Reliability 1/10
Price of the unique transaction of the last 120 months.
Dwellings
3 102 € /m²
Reliability 5/10
Median price on the 20 transactions of the last 48 months.
from 2 525 to
3 820 € /m²
3 820 € /m²
60% of transactions from the 2nd to the 8th deciles.
Yearly evolution
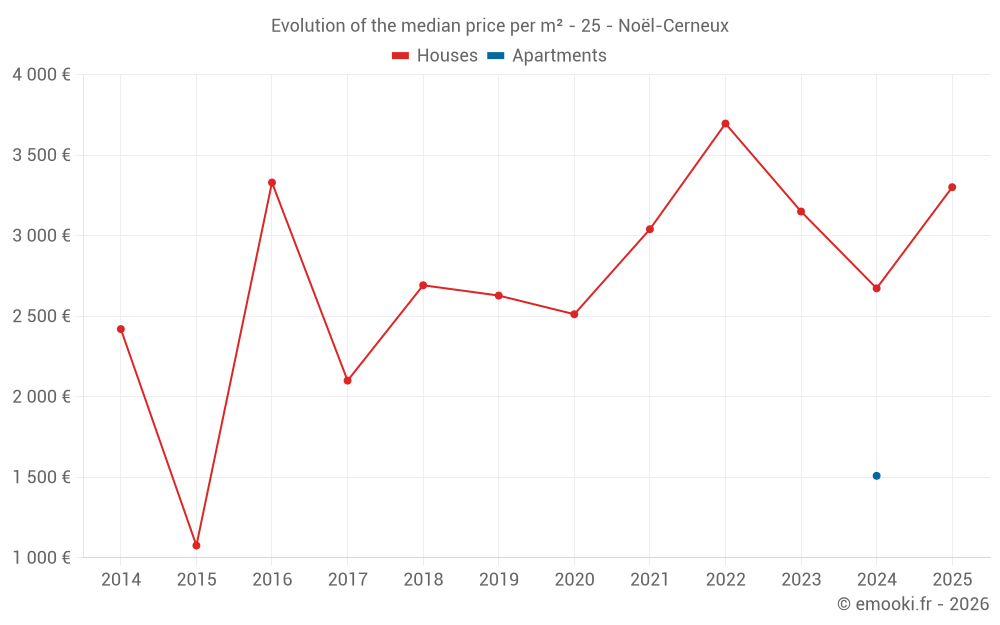
Evolution of the median price per m²
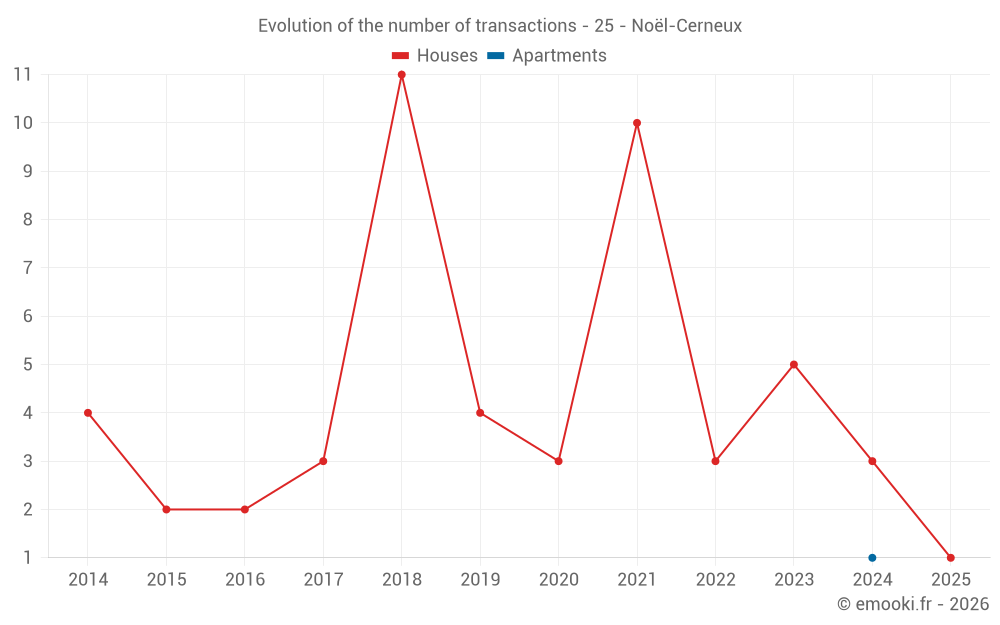
Evolution of the number of transactions
Warning, last year incomplete. Projections made based on the proportions between semesters of the previous year at the departmental/national level and by type of property.
Yearly data
Year
house
transactions
transactions
house
Price per m²
Price per m²
apt.
transactions
transactions
apt.
Price per m²
Price per m²
2025
1
3 301 €
0
--- €
2024
3
2 673 €
1
1 509 €
2023
5
3 150 €
0
--- €
2022
3
3 696 €
0
--- €
2021
10
3 040 €
0
--- €
2020
3
2 512 €
0
--- €
2019
4
2 628 €
0
--- €
2018
11
2 692 €
0
--- €
2017
3
2 100 €
0
--- €
2016
2
3 330 €
0
--- €
2015
2
1 076 €
0
--- €
2014
4
2 420 €
0
--- €
Analysis
Structure of prices per m²
Values of price percentiles per m² over the periods used for the estimated price of each type of property.
Structure of transaction amounts
Values of transaction amounts percentiles over the periods used for the estimated price of each type of property.
Transaction amounts and prices per m² by percentile
Percentile
house
Price per m²
Price per m²
house
Transaction amount
Transaction amount
apt.
Price per m²
Price per m²
apt.
Transaction amount
Transaction amount
10th percentile
1 742 €
222 K€
1 509 €
320 K€
20th percentile
2 671 €
298 K€
1 509 €
320 K€
30th percentile
2 816 €
305 K€
1 509 €
320 K€
40th percentile
3 033 €
327 K€
1 509 €
320 K€
50th percentile
3 150 €
340 K€
1 509 €
320 K€
60th percentile
3 287 €
345 K€
1 509 €
320 K€
70th percentile
3 396 €
362 K€
1 509 €
320 K€
80th percentile
3 945 €
369 K€
1 509 €
320 K€
90th percentile
4 609 €
389 K€
1 509 €
320 K€
National and departmental comparison
Evolution of the median price per m² of houses
Evolution of the median price per m² of apartments
Quarterly evolution
Evolution of the median price per m²
Evolution of the number of transactions
Quarterly data
Quarter
house
transactions
transactions
house
Price per m²
Price per m²
apt.
transactions
transactions
apt.
Price per m²
Price per m²
2025 Q1
1
3 301 €
0
--- €
2024 Q4
2
2 407 €
0
--- €
2024 Q1
1
2 673 €
1
1 509 €
2023 Q4
2
3 010 €
0
--- €
2023 Q2
2
3 287 €
0
--- €
2023 Q1
1
2 760 €
0
--- €
2022 Q2
1
3 696 €
0
--- €
2022 Q1
2
4 041 €
0
--- €
2021 Q3
7
3 053 €
0
--- €
2021 Q2
2
1 482 €
0
--- €
2021 Q1
1
3 589 €
0
--- €
2020 Q3
1
2 266 €
0
--- €
2020 Q2
1
2 512 €
0
--- €
2020 Q1
1
3 628 €
0
--- €
2019 Q4
2
2 803 €
0
--- €
2019 Q3
2
2 112 €
0
--- €
2018 Q4
1
3 018 €
0
--- €
2018 Q3
5
3 028 €
0
--- €
2018 Q1
5
2 628 €
0
--- €
2017 Q4
1
2 096 €
0
--- €
2017 Q3
1
2 100 €
0
--- €
2017 Q1
1
2 650 €
0
--- €
2016 Q4
2
3 330 €
0
--- €
2015 Q4
1
1 361 €
0
--- €
2015 Q1
1
790 €
0
--- €
2014 Q4
1
2 340 €
0
--- €
2014 Q3
1
2 500 €
0
--- €
2014 Q2
2
2 460 €
0
--- €
Overview of the latest real estate transactions
The following list is an anonymized overview of the latest transactions. For more details and to find all transactions, please use the map to view transactions by plot or the transaction search page for a search by criteria.
2025-02-10
373 000 €3 301 € /m²(113 m²)
Sale
House
4 rooms
113 m2
1 outbuilding
Land
894 m2
-Sols
2024-12-27
258 000 €4 607 € /m²(56 m²)
Sale
House
2 rooms
56 m2
1 outbuilding
Land
411 m2
-Sols
2024-10-29
25 000 €207 € /m²(121 m²)
Sale
House
7 rooms
121 m2
Land
221 m2
-Sols
2024-06-04
209 000 €Sale
Apartment
2024-03-19
320 000 €1 509 € /m²(212 m²)
Sale
Apartment
4 rooms
120 m2
Apartment
4 rooms
92 m2
1 outbuilding
Land
1652 m2
-Sols
2024-03-19
15 317 €Sale
Land
540 m2
-Sols
Land
361 m2
-Landes
/Friche
2024-02-21
358 228 €2 673 € /m²(134 m²)
Sale
House
5 rooms
134 m2
Land
949 m2
-Sols
2024-01-25
18 000 €Sale
Land
9173 m2
-Prés
Land
9173 m2
-Terres
Land
62 m2
-Terres
Land
554 m2
-Terres
Land
2010 m2
-Prés
Land
2011 m2
-Terres
2023-12-23
308 600 €3 354 € /m²(92 m²)
Sale
House
3 rooms
92 m2
Land
349 m2
-Sols
2023-10-12
400 000 €2 667 € /m²(150 m²)
Sale
House
6 rooms
150 m2
Land
867 m2
-Sols
2023-07-13
2 500 €Sale
Land
223 m2
-Landes
/Friche
Land
316 m2
-Terres
Land
1516 m2
-Landes
/Friche
2023-06-29
116 626 €Sale
Land
368 m2
-Landes
/Friche
Land
5140 m2
-Terres
2023-06-27
387 500 €3 150 € /m²(123 m²)
Sale
House
4 rooms
123 m2
1 outbuilding
Land
1062 m2
-Sols
2023-04-24
339 000 €3 424 € /m²(99 m²)
Sale
House
4 rooms
99 m2
Land
796 m2
-Sols
2023-02-21
295 300 €2 760 € /m²(107 m²)
Sale
House
5 rooms
107 m2
Land
650 m2
-Sols
Land
37 m2
-Sols
Land
391 m2
-Sols
2022-06-23
77 710 €transaction.nature.Vente terrain à bâtir
Land
818 m2
-Prés
2022-05-25
78 850 €transaction.nature.Vente terrain à bâtir
Land
829 m2
-Prés
2022-05-25
84 265 €transaction.nature.Vente terrain à bâtir
Land
886 m2
-Prés
2022-05-25
80 370 €transaction.nature.Vente terrain à bâtir
Land
847 m2
-Prés
2022-05-19
82 935 €transaction.nature.Vente terrain à bâtir
Land
874 m2
-Prés
115 transactions listed in the municipality
Compare with neighboring municipalities
City
name
name
house
Price per m²
Price per m²
apt.
Price per m²
Price per m²
City information
Zip code
- 25500 NOEL CERNEUX
Data source & update
- Latest publication of the property value request (DVF) database made available by the DGFiP on October 19, 2025, covering transactions up to 06/30/2025:
- Administrative/cadastral division as of September 1, 2025, and municipal movements as of January 1, 2025: