Real estate price map
Real estate price map in the municipality of Le Mémont, choose a section to see transactions by parcel.
Doubs (25)
Price per m² in Le Mémont
Median price of real estate
in the municipality of Le Mémont
Houses
1 578 € /m²
Reliability 3/10
Median price on the 8 transactions of the last 72 months.
Apartments
2 006 € /m²
Reliability 1/10
Price of the unique transaction of the last 120 months.
Dwellings
1 591 € /m²
Reliability 3/10
Median price on the 9 transactions of the last 72 months.
Yearly evolution
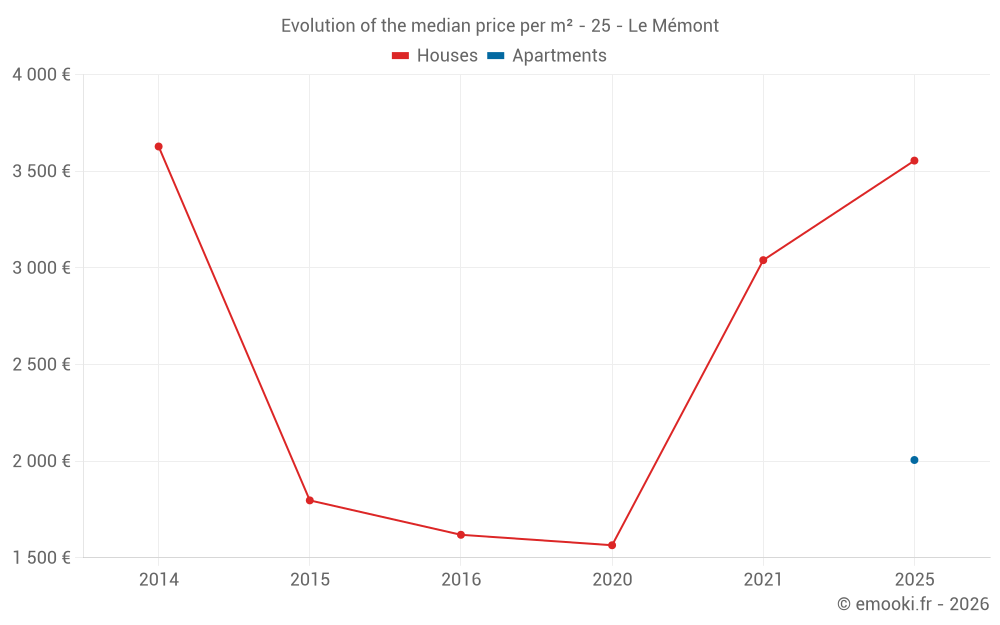
Evolution of the median price per m²
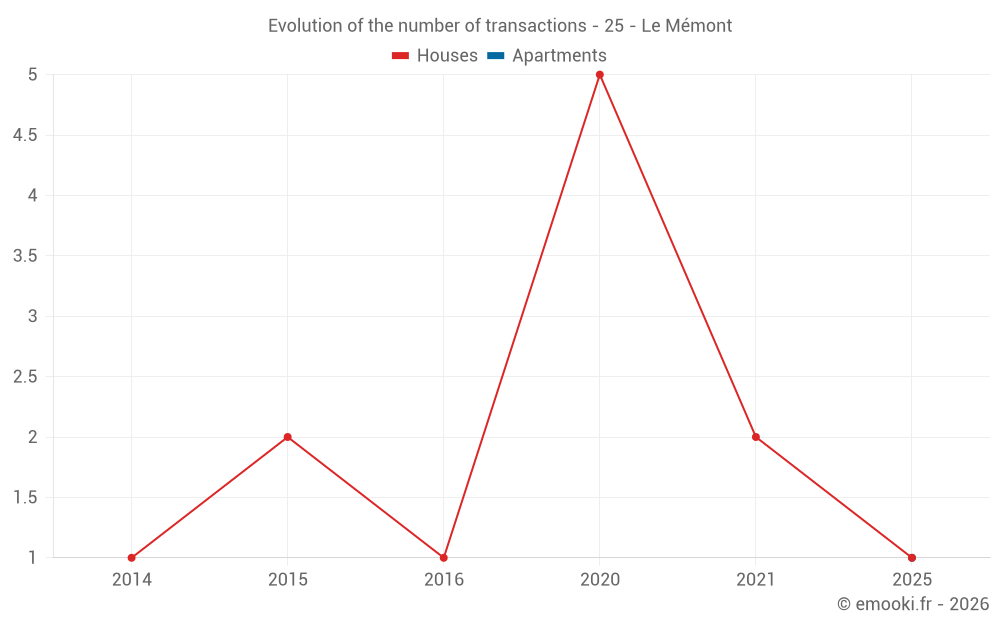
Evolution of the number of transactions
Warning, last year incomplete. Projections made based on the proportions between semesters of the previous year at the departmental/national level and by type of property.
Yearly data
Year
house
transactions
transactions
house
Price per m²
Price per m²
apt.
transactions
transactions
apt.
Price per m²
Price per m²
2025
1
3 555 €
1
2 006 €
2024
0
--- €
0
--- €
2023
0
--- €
0
--- €
2022
0
--- €
0
--- €
2021
2
3 040 €
0
--- €
2020
5
1 565 €
0
--- €
2019
0
--- €
0
--- €
2018
0
--- €
0
--- €
2017
0
--- €
0
--- €
2016
1
1 619 €
0
--- €
2015
2
1 797 €
0
--- €
2014
1
3 628 €
0
--- €
Analysis
Structure of prices per m²
Values of price percentiles per m² over the periods used for the estimated price of each type of property.
Structure of transaction amounts
Values of transaction amounts percentiles over the periods used for the estimated price of each type of property.
Transaction amounts and prices per m² by percentile
Percentile
house
Price per m²
Price per m²
house
Transaction amount
Transaction amount
apt.
Price per m²
Price per m²
apt.
Transaction amount
Transaction amount
10th percentile
1 160 €
194 K€
2 006 €
421 K€
20th percentile
1 413 €
229 K€
2 006 €
421 K€
30th percentile
1 543 €
233 K€
2 006 €
421 K€
40th percentile
1 560 €
243 K€
2 006 €
421 K€
50th percentile
1 578 €
247 K€
2 006 €
421 K€
60th percentile
1 984 €
257 K€
2 006 €
421 K€
70th percentile
3 359 €
289 K€
2 006 €
421 K€
80th percentile
3 934 €
300 K€
2 006 €
421 K€
90th percentile
4 293 €
309 K€
2 006 €
421 K€
National and departmental comparison
Evolution of the median price per m² of houses
Evolution of the median price per m² of apartments
Quarterly evolution
Evolution of the median price per m²
Evolution of the number of transactions
Quarterly data
Quarter
house
transactions
transactions
house
Price per m²
Price per m²
apt.
transactions
transactions
apt.
Price per m²
Price per m²
2025 Q2
0
--- €
1
2 006 €
2025 Q1
1
3 555 €
0
--- €
2021 Q3
1
4 539 €
0
--- €
2021 Q1
1
1 541 €
0
--- €
2020 Q4
2
1 179 €
0
--- €
2020 Q3
1
4 187 €
0
--- €
2020 Q2
1
1 328 €
0
--- €
2020 Q1
1
1 565 €
0
--- €
2016 Q4
1
1 619 €
0
--- €
2015 Q3
1
1 879 €
0
--- €
2015 Q2
1
1 715 €
0
--- €
2014 Q3
1
3 628 €
0
--- €
Overview of the latest real estate transactions
The following list is an anonymized overview of the latest transactions. For more details and to find all transactions, please use the map to view transactions by plot or the transaction search page for a search by criteria.
2025-06-16
421 300 €2 006 € /m²(210 m²)
Sale
Apartment
3 rooms
90 m2
Apartment
5 rooms
120 m2
3 outbuildings
Land
909 m2
-Terres
Land
930 m2
-Futaies résineuses
Land
1155 m2
-Terres
Land
1150 m2
-Terres
2025-01-24
231 100 €3 555 € /m²(65 m²)
Sale
House
4 rooms
65 m2
Land
1003 m2
-Sols
2024-07-10
2 300 €Sale
Land
230 m2
-Sols
2023-07-21
117 609 €Sale
Land
9450 m2
-Terres
Land
24810 m2
-Terres
Land
5430 m2
-Prés
Land
44948 m2
-Terres
Land
30015 m2
-Terres
Land
650 m2
-Landes
/Friche
Land
22000 m2
-Terres
Land
23285 m2
-Terres
Land
1000 m2
-Sols
Land
14080 m2
-Prés
Land
14552 m2
-Terres
Land
619 m2
-Terres
Land
365 m2
-Prés
Land
3305 m2
-Prés
2022-07-26
13 725 €Sale
1 outbuilding
Land
370 m2
-Sols
2021-08-16
317 750 €4 539 € /m²(70 m²)
Sale
House
3 rooms
70 m2
1 outbuilding
Land
983 m2
-Sols
Land
47 m2
-Sols
2021-07-16
1 700 €Sale
Land
7845 m2
-Futaies résineuses
2021-02-26
228 000 €1 541 € /m²(148 m²)
Sale
House
6 rooms
148 m2
Land
1026 m2
-Sols
2021-01-14
200 €Sale
Land
18 m2
-Sols
Land
97 m2
-Terres
Land
96 m2
-Terres
2020-12-18
248 200 €1 591 € /m²(156 m²)
Sale
House
4 rooms
156 m2
Land
550 m2
-Sols
Land
921 m2
-Terres
Land
1066 m2
-Terres
Land
1065 m2
-Terres
2020-10-02
115 000 €767 € /m²(150 m²)
Sale
House
4 rooms
150 m2
Land
785 m2
-Sols
Land
550 m2
-Jardins
Land
400 m2
-Terres
Land
2570 m2
-Terres
2020-08-11
8 800 €Sale
Land
15760 m2
-Landes
/Friche
Land
1600 m2
-Landes
/Friche
2020-07-31
293 100 €4 187 € /m²(70 m²)
Sale
House
3 rooms
70 m2
Land
983 m2
-Sols
Land
47 m2
-Sols
2020-06-26
245 700 €1 328 € /m²(185 m²)
Sale
House
4 rooms
185 m2
Land
1017 m2
-Sols
Land
5850 m2
-Prés
Land
730 m2
-Jardins
Land
294 m2
-Prés
Land
78 m2
-Sols
Land
323 m2
-Prés
Land
2714 m2
-Prés
2020-02-27
305 200 €1 565 € /m²(195 m²)
Sale
House
5 rooms
195 m2
Land
1800 m2
-Sols
2017-10-31
94 €1 € /m²(70 m²)
Exchange
House
3 rooms
70 m2
Land
47 m2
-Sols
Land
47 m2
-Sols
2017-09-05
7 000 €Sale
Land
4500 m2
-Futaies résineuses
2016-12-05
183 000 €1 619 € /m²(113 m²)
Sale
House
4 rooms
95 m2
House
1 room
18 m2
2016-12-05
930 €Sale
Land
93 m2
-Sols
2015-09-10
291 200 €1 879 € /m²(155 m²)
Sale
House
7 rooms
155 m2
Land
1800 m2
-Sols
23 transactions listed in the municipality
Compare with neighboring municipalities
City
name
name
house
Price per m²
Price per m²
apt.
Price per m²
Price per m²
City information
Zip code
- 25210 LE MEMONT
Data source & update
- Latest publication of the property value request (DVF) database made available by the DGFiP on October 19, 2025, covering transactions up to 06/30/2025:
- Administrative/cadastral division as of September 1, 2025, and municipal movements as of January 1, 2025: