Median price of real estate
in the municipality of Pays-de-Montbenoît
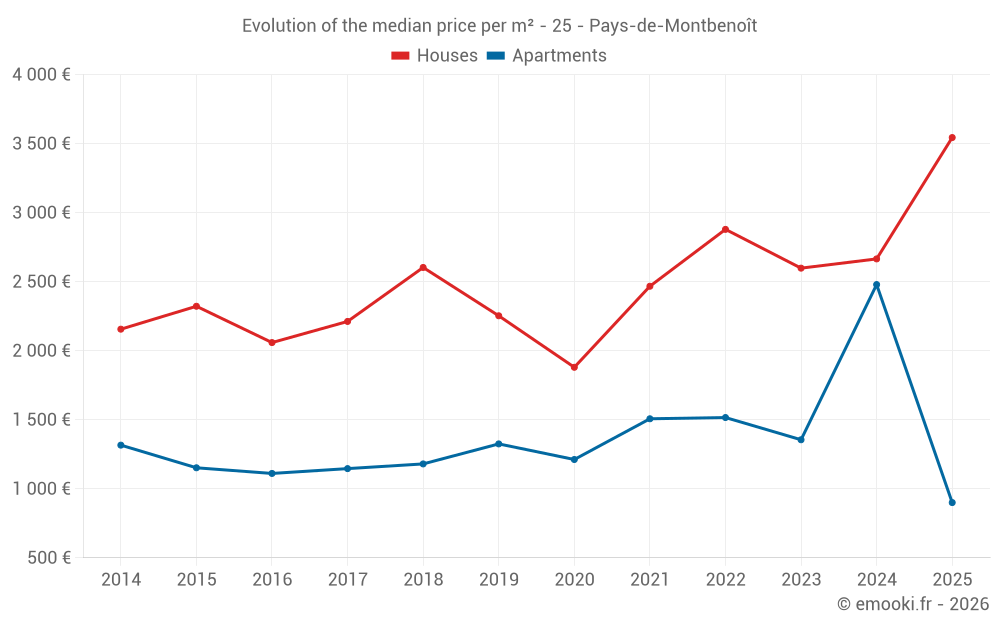
Houses
2 719 € /m²
Reliability 7/10
Median price on the 17 transactions of the last 24 months.
from 2 203 to
3 353 € /m²
3 353 € /m²
60% of transactions from the 2nd to the 8th deciles.
Apartments
1 419 € /m²
Reliability 6/10
Median price on the 14 transactions of the last 36 months.
from 1 076 to
2 446 € /m²
2 446 € /m²
60% of transactions from the 2nd to the 8th deciles.
Dwellings
2 595 € /m²
Reliability 7/10
Median price on the 22 transactions of the last 24 months.
from 1 746 to
3 353 € /m²
3 353 € /m²
60% of transactions from the 2nd to the 8th deciles.