emooki
HomePrice mapTransactions
🇬🇧 English🇫🇷 Français🇩🇪 Deutsch🇪🇸 Español🇮🇹 Italiano

Real estate price map


Real estate price map in the municipality of Gilley, choose a section to see transactions by parcel.

Doubs (25)

Gilley - Real estate price m²

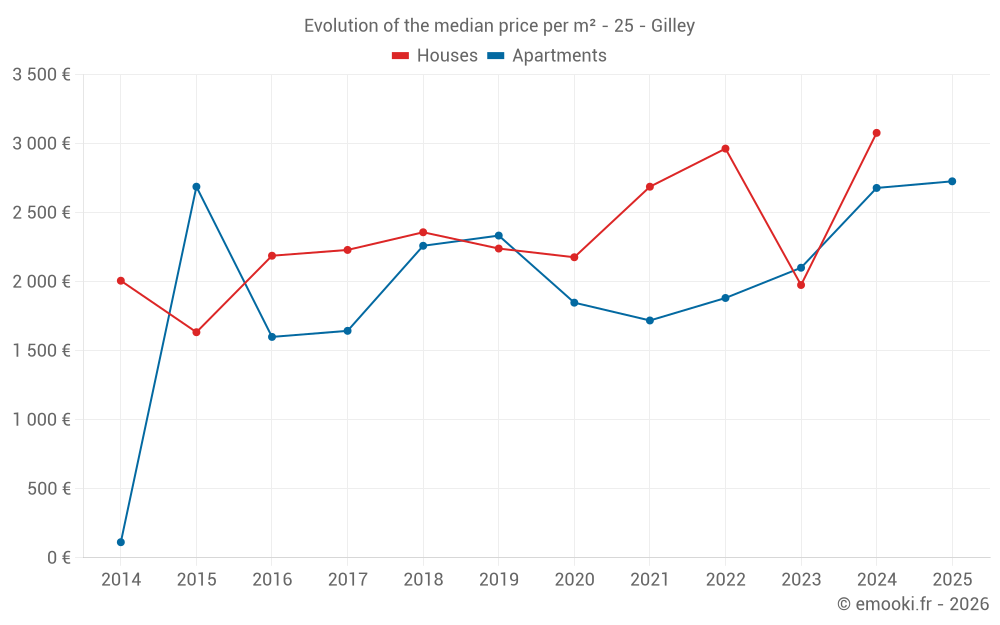
Median price of real estate
in the municipality of Gilley

HousesHouses
2 557  /m²
1-23-45-67-89-10
Reliability 7/10
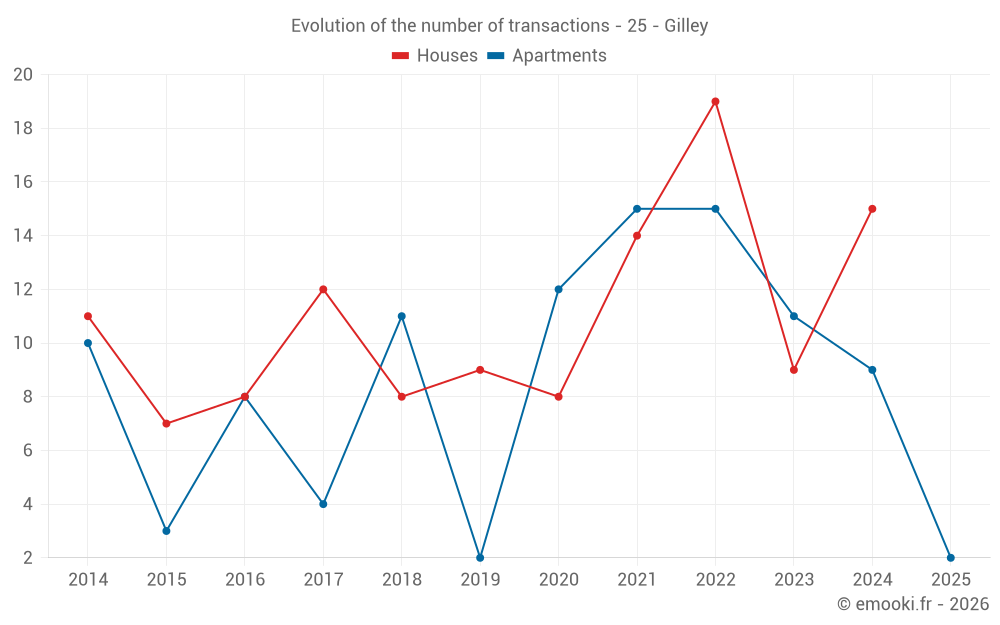
Median price on the 21 transactions of the last 24 months.
from 1 408 to
3 383  /m²
60% of transactions from the 2nd to the 8th deciles.
ApartmentsApartments
2 460  /m²
1-23-45-67-89-10
Reliability 7/10
Median price on the 16 transactions of the last 24 months.
from 1 706 to
3 554  /m²
60% of transactions from the 2nd to the 8th deciles.
DwellingsDwellings
3 028  /m²
1-23-45-67-89-10
Reliability 8/10
Median price on the 17 transactions of the last 12 months.
from 2 067 to
3 448  /m²
60% of transactions from the 2nd to the 8th deciles.

Yearly evolution

Evolution of the median price per m²

Evolution of the median price per m² - 25 - Gilley

Evolution of the number of transactions

Warning, last year incomplete. Projections made based on the proportions between semesters of the previous year at the departmental/national level and by type of property.

Evolution of the number of transactions - 25 - Gilley

Yearly data

Descending order
Year
Houses
house
transactions
Houses
house
Price per m²
Apartments
apt.
transactions
Apartments
apt.
Price per m²
2025
0
--- 
2
2 727 
2024
15
3 078 
9
2 679 
2023
9
1 976 
11
2 101 
2022
19
2 964 
15
1 882 
2021
14
2 688 
15
1 719 
2020
8
2 177 
12
1 848 
2019
9
2 240 
2
2 334 
2018
8
2 358 
11
2 260 
2017
12
2 230 
4
1 644 
2016
8
2 188 
8
1 600 
2015
7
1 634 
3
2 688 
2014
11
2 007 
10
113 

Analysis

Structure of prices per m²

Values of price percentiles per m² over the periods used for the estimated price of each type of property.

Structure of transaction amounts

Values of transaction amounts percentiles over the periods used for the estimated price of each type of property.

Transaction amounts and prices per m² by percentile

Ascending order
Percentile
Houses
house
Price per m²
Houses
house
Transaction amount
Apartments
apt.
Price per m²
Apartments
apt.
Transaction amount
10th percentile
716 
71 600 
1 582 
101 K
20th percentile
1 408 
175 K
1 706 
142 K
30th percentile
1 788 
240 K
1 872 
160 K
40th percentile
2 361 
285 K
2 347 
187 K
50th percentile
2 557 
309 K
2 460 
199 K
60th percentile
3 078 
320 K
2 679 
215 K
70th percentile
3 252 
335 K
3 122 
224 K
80th percentile
3 383 
357 K
3 554 
243 K
90th percentile
3 429 
451 K
3 566 
265 K

National and departmental comparison

Evolution of the median price per m² of houses

Evolution of the median price per m² of apartments

Quarterly evolution

Evolution of the median price per m²

Evolution of the number of transactions

Quarterly data

Descending order
Quarter
Houses
house
transactions
Houses
house
Price per m²
Apartments
apt.
transactions
Apartments
apt.
Price per m²
2025 Q1
0
--- 
2
2 727 
2024 Q4
4
3 268 
3
2 679 
2024 Q3
6
2 792 
2
2 602 
2024 Q2
3
716 
1
2 347 
2024 Q1
2
3 622 
3
2 784 
2023 Q4
4
1 764 
0
--- 
2023 Q3
2
1 213 
5
2 394 
2023 Q2
1
3 770 
2
2 350 
2023 Q1
2
2 210 
4
1 982 
2022 Q4
9
2 993 
6
1 968 
2022 Q3
3
2 964 
2
2 396 
2022 Q2
4
2 688 
6
1 682 
2022 Q1
3
3 245 
1
2 402 
2021 Q4
3
2 319 
6
1 592 
2021 Q3
3
2 955 
3
2 375 
2021 Q2
4
2 318 
1
1 042 
2021 Q1
4
2 880 
5
1 662 
2020 Q4
3
1 236 
5
2 434 
2020 Q3
2
1 874 
6
1 756 
2020 Q2
2
2 660 
0
--- 
2020 Q1
1
2 458 
1
1 350 
2019 Q4
1
3 190 
2
2 334 
2019 Q3
4
2 126 
0
--- 
2019 Q2
1
2 250 
0
--- 
2019 Q1
3
2 240 
0
--- 
2018 Q4
2
2 398 
2
2 342 
2018 Q3
2
2 774 
4
2 052 
2018 Q2
2
1 962 
2
1 632 
2018 Q1
2
1 470 
3
2 260 
2017 Q4
3
1 558 
1
1 838 
2017 Q3
4
2 365 
0
--- 
2017 Q2
4
1 873 
2
1 368 
2017 Q1
1
3 019 
1
2 213 
2016 Q4
4
2 013 
1
1 200 
2016 Q3
2
2 714 
0
--- 
2016 Q2
1
840 
1
1 938 
2016 Q1
1
2 282 
6
1 600 
2015 Q4
2
2 121 
1
2 061 
2015 Q3
2
2 238 
1
2 705 
2015 Q2
1
1 385 
1
2 688 
2015 Q1
2
1 808 
0
--- 
2014 Q4
1
2 025 
1
1 163 
2014 Q3
4
2 024 
1
1 930 
2014 Q2
4
1 654 
1
1 476 
2014 Q1
2
1 567 
7
5 

Overview of the latest real estate transactions

The following list is an anonymized overview of the latest transactions. For more details and to find all transactions, please use the map to view transactions by plot or the transaction search page for a search by criteria.

2025-04-03
18 700 
Sale
Land
16830 m2
-Prés
Land
80 m2
-Sols
Land
650 m2
-Terres
Land
2216 m2
-Prés
Land
1255 m2
-Landes
/Friche
Land
1725 m2
-Terres
Land
7334 m2
-Terres
Land
4664 m2
-Terres
2025-04-03
1 150 
Sale
Land
2560 m2
-Terres
2025-03-28
126 880 
Sale
Land
793 m2
-Terres
2025-03-25
350 
Sale
Land
990 m2
-Terres
2025-03-24
199 400 
1 994  /m²(100 m²)
Sale
Apartments
Apartment
4 rooms
100 m2
1 outbuilding
2025-03-20
23 000 
Sale
Land
5233 m2
-Terres
Land
10467 m2
-Terres
Land
1880 m2
-Prés
Land
1976 m2
-Futaies résineuses
Land
45592 m2
-Prés
2025-03-14
200 000 
Sale
Land
1640 m2
-Prés
Land
2 m2
-Sols
2025-03-11
218 000 
3 460  /m²(63 m²)
Sale
Apartments
Apartment
3 rooms
63 m2
3 outbuildings
2025-02-06
9 500 
Sale
Land
11093 m2
-Terres
Land
1550 m2
-Terres
Land
7482 m2
-Prés
Land
3099 m2
-Terres
Land
1596 m2
-Taillis simples
2024-12-30
2 350 
Sale
Land
94 m2
-Sols
2024-12-20
215 000 
1 706  /m²(126 m²)
Sale
Apartments
Apartment
5 rooms
126 m2
2024-11-29
21 385 
Sale
Land
329 m2
-Terres
2024-11-22
280 000 
3 684  /m²(76 m²)
Sale
Houses
House
4 rooms
76 m2
Land
600 m2
-Sols
Land
960 m2
-Prés
2024-11-20
148 000 
Sale
Land
26 m2
-Terres
Land
839 m2
-Terres
Land
35 m2
-Terres
2024-11-18
320 000 
2 370  /m²(135 m²)
Sale
Land
802 m2
-Terres
Houses
House
5 rooms
135 m2
Land
799 m2
-Terres
2024-11-15
313 550 
3 136  /m²(100 m²)
Sale
Houses
House
4 rooms
100 m2
Land
735 m2
-Sols
2024-10-25
142 000 
2 679  /m²(53 m²)
Sale
Apartments
Apartment
3 rooms
53 m2
2 outbuildings
1 outbuilding
1 outbuilding
2024-10-17
323 000 
3 400  /m²(95 m²)
Sale
Houses
House
5 rooms
95 m2
Land
798 m2
-Sols
2024-10-11
109 755 
transaction.nature.Vente terrain à bâtir
Land
813 m2
-Prés
2024-10-01
89 000 
3 560  /m²(25 m²)
Sale
Apartments
Apartment
1 room
25 m2
518 transactions listed in the municipality

Doubs (25)

Most expensive cities

City
name
Descending orderHouses
house
Price per m²
4 618 
4 041 
3 939 
3 768 
3 664 
3 529 
3 455 
City
name
Descending orderApartments
apt.
Price per m²
9 000 
3 578 
3 531 
3 523 
3 317 
3 250 
3 209 
3 192 

Least expensive cities

City
name
Ascending orderHouses
house
Price per m²
322 
356 
419 
464 
535 
602 
608 
City
name
Ascending orderApartments
apt.
Price per m²
86 
119 
134 
179 
184 
184 
228