Real estate price map
Real estate price map in the municipality of Goux-lès-Dambelin, choose a section to see transactions by parcel.
Doubs (25)
Price per m² in Goux-lès-Dambelin
Median price of real estate
in the municipality of Goux-lès-Dambelin
Houses
1 519 € /m²
Reliability 3/10
Median price on the 6 transactions of the last 72 months.
Apartments
1 004 € /m²
Reliability 2/10
Median price on the 6 transactions of the last 96 months.
Dwellings
1 208 € /m²
Reliability 3/10
Median price on the 11 transactions of the last 72 months.
from 1 022 to
1 625 € /m²
1 625 € /m²
60% of transactions from the 2nd to the 8th deciles.
Yearly evolution
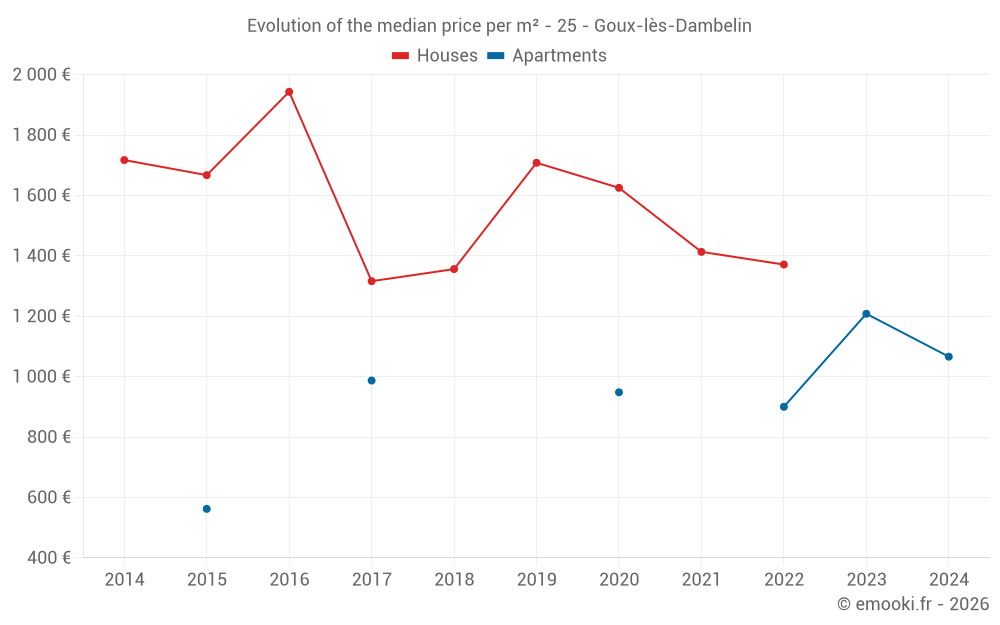
Evolution of the median price per m²
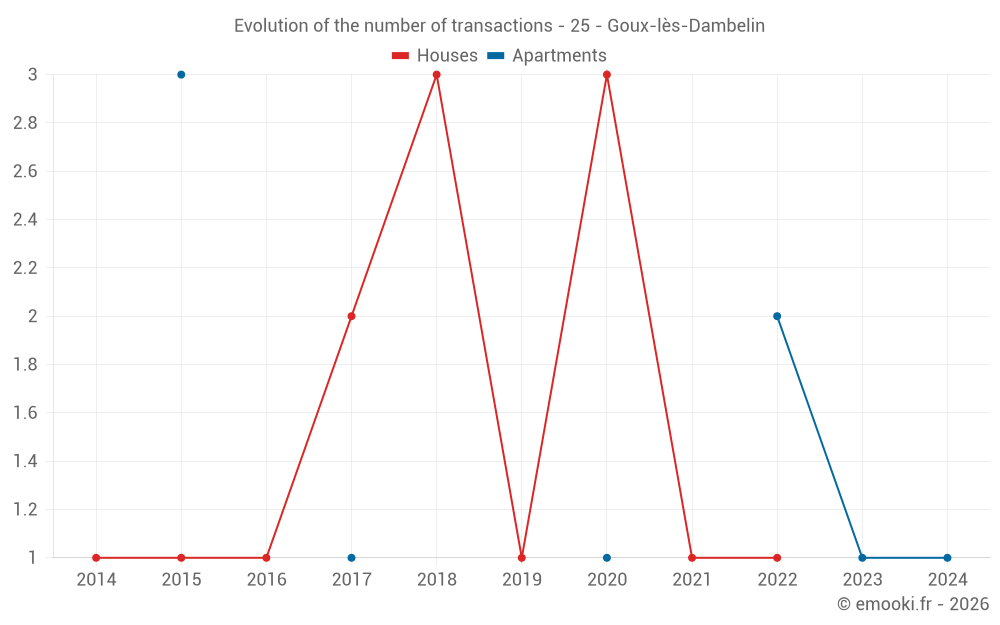
Evolution of the number of transactions
Warning, last year incomplete. Projections made based on the proportions between semesters of the previous year at the departmental/national level and by type of property.
Yearly data
Year
house
transactions
transactions
house
Price per m²
Price per m²
apt.
transactions
transactions
apt.
Price per m²
Price per m²
2025
0
--- €
0
--- €
2024
0
--- €
1
1 066 €
2023
0
--- €
1
1 208 €
2022
1
1 371 €
2
900 €
2021
1
1 413 €
0
--- €
2020
3
1 625 €
1
948 €
2019
1
1 708 €
0
--- €
2018
3
1 356 €
0
--- €
2017
2
1 316 €
1
987 €
2016
1
1 943 €
0
--- €
2015
1
1 667 €
3
562 €
2014
1
1 717 €
0
--- €
Analysis
Structure of prices per m²
Values of price percentiles per m² over the periods used for the estimated price of each type of property.
Structure of transaction amounts
Values of transaction amounts percentiles over the periods used for the estimated price of each type of property.
Transaction amounts and prices per m² by percentile
Percentile
house
Price per m²
Price per m²
house
Transaction amount
Transaction amount
apt.
Price per m²
Price per m²
apt.
Transaction amount
Transaction amount
10th percentile
1 198 €
152 K€
863 €
71 500 €
20th percentile
1 371 €
156 K€
948 €
73 000 €
30th percentile
1 392 €
158 K€
968 €
73 500 €
40th percentile
1 413 €
159 K€
987 €
74 000 €
50th percentile
1 519 €
164 K€
1 004 €
78 050 €
60th percentile
1 625 €
168 K€
1 022 €
82 100 €
70th percentile
1 666 €
170 K€
1 044 €
86 350 €
80th percentile
1 708 €
172 K€
1 066 €
90 600 €
90th percentile
1 844 €
189 K€
1 137 €
112 K€
National and departmental comparison
Evolution of the median price per m² of houses
Evolution of the median price per m² of apartments
Quarterly evolution
Evolution of the median price per m²
Evolution of the number of transactions
Quarterly data
Quarter
house
transactions
transactions
house
Price per m²
Price per m²
apt.
transactions
transactions
apt.
Price per m²
Price per m²
2024 Q4
0
--- €
1
1 066 €
2023 Q3
0
--- €
1
1 208 €
2022 Q2
0
--- €
1
778 €
2022 Q1
1
1 371 €
1
1 022 €
2021 Q3
1
1 413 €
0
--- €
2020 Q2
1
1 625 €
1
948 €
2020 Q1
2
1 502 €
0
--- €
2019 Q3
1
1 708 €
0
--- €
2018 Q4
1
1 356 €
0
--- €
2018 Q3
1
1 586 €
0
--- €
2018 Q2
1
891 €
0
--- €
2017 Q3
2
1 316 €
1
987 €
2016 Q3
1
1 943 €
0
--- €
2015 Q4
1
1 667 €
0
--- €
2015 Q2
0
--- €
3
562 €
2014 Q3
1
1 717 €
0
--- €
Overview of the latest real estate transactions
The following list is an anonymized overview of the latest transactions. For more details and to find all transactions, please use the map to view transactions by plot or the transaction search page for a search by criteria.
2025-03-28
15 400 €Sale
Land
961 m2
-Landes
/Friche
Land
14354 m2
-Prés
Land
14353 m2
-Prés
2024-12-17
82 100 €1 066 € /m²(77 m²)
Sale
Apartment
4 rooms
77 m2
2024-11-28
13 800 €Sale
Land
8120 m2
-Terres
Land
8700 m2
-Vergers
Land
14560 m2
-Terres
Land
5840 m2
-Terres
2024-07-18
200 €Sale
Land
353 m2
-Prés
2024-07-18
2 300 €Sale
Land
6580 m2
-Terres
2024-06-26
2 500 €Sale
Land
1570 m2
-Taillis simples
Land
1680 m2
-Taillis simples
2024-03-06
8 500 €Sale
Land
229 m2
-Prés
2024-01-30
5 180 €Sale
Land
1900 m2
-Taillis simples
Land
10390 m2
-Terres
Land
1597 m2
-Taillis simples
Land
573 m2
-Taillis simples
Land
790 m2
-Taillis simples
2024-01-12
62 000 €Sale
Land
7170 m2
-Terres
2023-11-04
55 000 €Sale
Land
412 m2
-Vergers
Land
125 m2
-Landes
/Friche
2023-10-23
2 870 €Sale
Land
8170 m2
-Terres
2023-10-16
14 902 €Sale
Land
2220 m2
-Taillis simples
Land
11240 m2
-Prés
Land
16230 m2
-Terres
Land
4197 m2
-Terres
Land
8393 m2
-Terres
2023-08-31
90 600 €1 208 € /m²(75 m²)
Sale
Apartment
4 rooms
75 m2
3 outbuildings
2023-04-24
500 €Sale
Land
980 m2
-Taillis simples
Land
530 m2
-Taillis simples
2022-05-03
949 €Sale
Land
2010 m2
-Taillis simples
Land
3564 m2
-Taillis simples
Land
1069 m2
-Futaies résineuses
Land
3207 m2
-Taillis simples
Land
4725 m2
-Taillis simples
Land
4020 m2
-Taillis simples
Land
3230 m2
-Taillis simples
Land
945 m2
-Futaies résineuses
Land
945 m2
-Taillis simples
2022-05-03
145 €Sale
Land
630 m2
-Taillis sous futaie
Land
445 m2
-Taillis simples
Land
1812 m2
-Terres
Land
760 m2
-Taillis simples
2022-04-27
17 500 €Sale
Land
792 m2
-Sols
Land
73 m2
-Landes
/Friche
2022-04-19
70 000 €778 € /m²(90 m²)
Sale
Apartment
4 rooms
90 m2
2 outbuildings
2022-02-23
159 000 €1 371 € /m²(116 m²)
Sale
House
4 rooms
116 m2
Land
719 m2
-Sols
Land
2000 m2
-Vergers
2022-02-08
132 800 €1 022 € /m²(130 m²)
Sale
Apartment
5 rooms
130 m2
2 outbuildings
67 transactions listed in the municipality
Compare with neighboring municipalities
City
name
name
house
Price per m²
Price per m²
apt.
Price per m²
Price per m²
City information
Zip code
- 25150 GOUX LES DAMBELIN
Data source & update
- Latest publication of the property value request (DVF) database made available by the DGFiP on October 19, 2025, covering transactions up to 06/30/2025:
- Administrative/cadastral division as of September 1, 2025, and municipal movements as of January 1, 2025: