Real estate price map
Real estate price map in the municipality of Dambelin, choose a section to see transactions by parcel.
Doubs (25)
Price per m² in Dambelin
Median price of real estate
in the municipality of Dambelin
Houses
1 420 € /m²
Reliability 5/10
Median price on the 15 transactions of the last 48 months.
from 1 101 to
1 709 € /m²
1 709 € /m²
60% of transactions from the 2nd to the 8th deciles.
Apartments
1 216 € /m²
Reliability 2/10
Median price on the 5 transactions of the last 96 months.
Dwellings
1 448 € /m²
Reliability 5/10
Median price on the 17 transactions of the last 48 months.
from 1 208 to
1 692 € /m²
1 692 € /m²
60% of transactions from the 2nd to the 8th deciles.
Yearly evolution
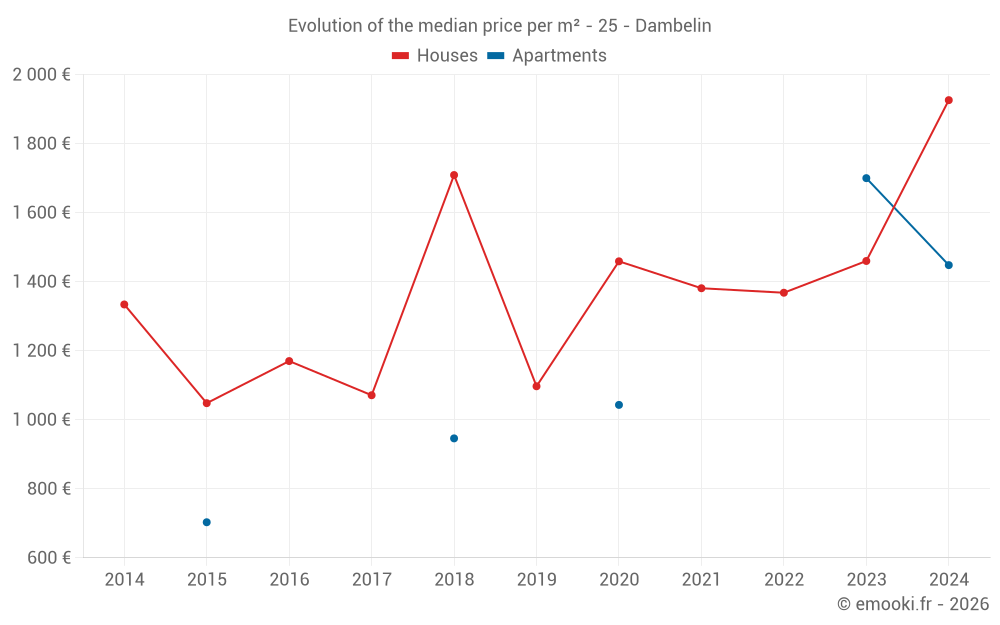
Evolution of the median price per m²
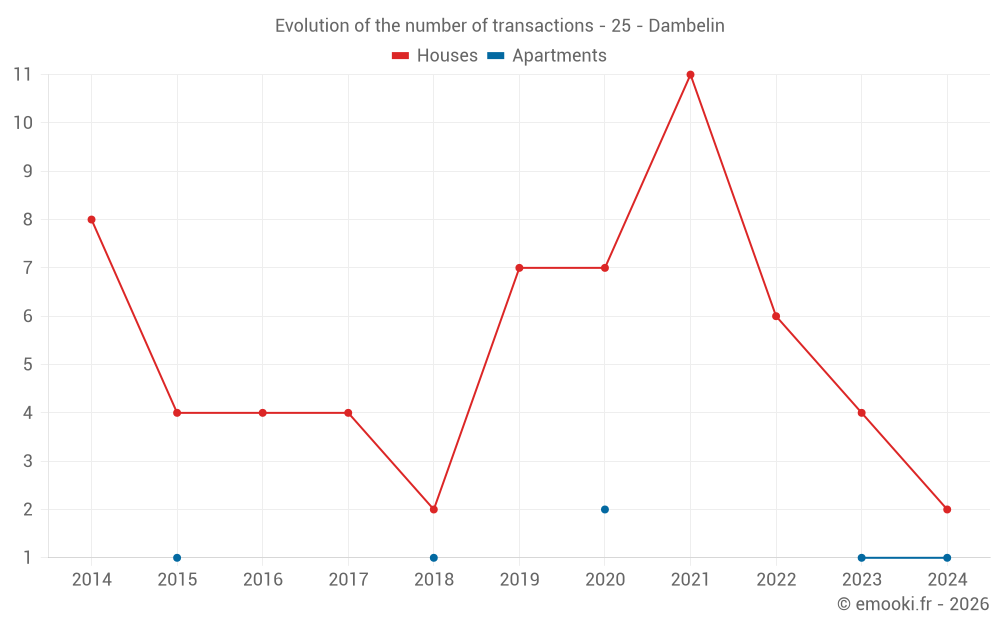
Evolution of the number of transactions
Warning, last year incomplete. Projections made based on the proportions between semesters of the previous year at the departmental/national level and by type of property.
Yearly data
Year
house
transactions
transactions
house
Price per m²
Price per m²
apt.
transactions
transactions
apt.
Price per m²
Price per m²
2025
0
--- €
0
--- €
2024
2
1 926 €
1
1 448 €
2023
4
1 460 €
1
1 700 €
2022
6
1 368 €
0
--- €
2021
11
1 381 €
0
--- €
2020
7
1 459 €
2
1 043 €
2019
7
1 097 €
0
--- €
2018
2
1 709 €
1
946 €
2017
4
1 071 €
0
--- €
2016
4
1 170 €
0
--- €
2015
4
1 048 €
1
703 €
2014
8
1 334 €
0
--- €
Analysis
Structure of prices per m²
Values of price percentiles per m² over the periods used for the estimated price of each type of property.
Structure of transaction amounts
Values of transaction amounts percentiles over the periods used for the estimated price of each type of property.
Transaction amounts and prices per m² by percentile
Percentile
house
Price per m²
Price per m²
house
Transaction amount
Transaction amount
apt.
Price per m²
Price per m²
apt.
Transaction amount
Transaction amount
10th percentile
461 €
75 000 €
900 €
79 560 €
20th percentile
1 101 €
99 000 €
931 €
82 520 €
30th percentile
1 272 €
129 K€
1 000 €
87 200 €
40th percentile
1 368 €
154 K€
1 108 €
93 600 €
50th percentile
1 420 €
178 K€
1 216 €
100 K€
60th percentile
1 482 €
215 K€
1 309 €
107 K€
70th percentile
1 601 €
231 K€
1 402 €
114 K€
80th percentile
1 709 €
244 K€
1 498 €
128 K€
90th percentile
1 929 €
254 K€
1 599 €
149 K€
National and departmental comparison
Evolution of the median price per m² of houses
Evolution of the median price per m² of apartments
Quarterly evolution
Evolution of the median price per m²
Evolution of the number of transactions
Quarterly data
Quarter
house
transactions
transactions
house
Price per m²
Price per m²
apt.
transactions
transactions
apt.
Price per m²
Price per m²
2024 Q4
0
--- €
1
1 448 €
2024 Q3
1
1 914 €
0
--- €
2024 Q2
1
1 939 €
0
--- €
2023 Q4
2
1 523 €
0
--- €
2023 Q3
1
1 500 €
0
--- €
2023 Q1
1
735 €
1
1 700 €
2022 Q4
1
1 266 €
0
--- €
2022 Q3
2
1 812 €
0
--- €
2022 Q2
2
968 €
0
--- €
2022 Q1
1
1 193 €
0
--- €
2021 Q4
1
1 296 €
0
--- €
2021 Q3
2
738 €
0
--- €
2021 Q2
2
1 884 €
0
--- €
2021 Q1
6
1 220 €
0
--- €
2020 Q4
3
1 776 €
0
--- €
2020 Q3
2
1 300 €
0
--- €
2020 Q2
1
360 €
1
1 216 €
2020 Q1
1
1 522 €
1
870 €
2019 Q4
4
838 €
0
--- €
2019 Q3
1
1 188 €
0
--- €
2019 Q2
2
1 359 €
0
--- €
2018 Q4
1
1 351 €
1
946 €
2018 Q1
1
2 067 €
0
--- €
2017 Q4
1
684 €
0
--- €
2017 Q3
2
1 484 €
0
--- €
2017 Q2
1
560 €
0
--- €
2016 Q4
1
1 316 €
0
--- €
2016 Q1
3
1 023 €
0
--- €
2015 Q4
1
686 €
0
--- €
2015 Q2
2
1 136 €
0
--- €
2015 Q1
1
1 000 €
1
703 €
2014 Q4
2
1 532 €
0
--- €
2014 Q3
2
1 251 €
0
--- €
2014 Q2
1
1 596 €
0
--- €
2014 Q1
3
1 071 €
0
--- €
Overview of the latest real estate transactions
The following list is an anonymized overview of the latest transactions. For more details and to find all transactions, please use the map to view transactions by plot or the transaction search page for a search by criteria.
2025-06-26
16 000 €Sale
Land
14920 m2
-Landes
/Broussailles ou buissons
Land
1950 m2
-Taillis simples
Land
1400 m2
-Prés
Land
5948 m2
-Taillis sous futaie
Land
1150 m2
-Taillis simples
Land
2230 m2
-Taillis simples
2024-12-12
13 840 €Sale
Land
11900 m2
-Terres
Land
11350 m2
-Prés
2024-11-15
60 500 €Sale
Land
60930 m2
-Taillis simples
2024-10-31
84 000 €1 448 € /m²(58 m²)
Sale
Apartment
2 rooms
58 m2
2 outbuildings
Land
439 m2
-Sols
2024-08-23
254 500 €1 914 € /m²(133 m²)
Sale
House
5 rooms
133 m2
Land
503 m2
-Sols
Land
341 m2
-Sols
2024-06-03
85 000 €Sale
Land
541 m2
-Sols
2024-05-28
198 €Sale
Land
795 m2
-Futaies résineuses
2024-05-07
160 900 €536 € /m²(300 m²)
Sale
Commercial property
300 m2
Land
941 m2
-Sols
2024-04-23
252 100 €1 939 € /m²(130 m²)
Sale
House
5 rooms
130 m2
2 outbuildings
Land
1005 m2
-Sols
2024-04-04
1 000 €Sale
Land
1435 m2
-Futaies résineuses
Land
4741 m2
-Futaies résineuses
Land
4741 m2
-Taillis sous futaie
2024-02-02
2 000 €Sale
Land
32 m2
-Sols
2024-01-25
13 769 €Sale
Land
12590 m2
-Prés
Land
1570 m2
-Taillis simples
2023-11-20
125 000 €1 420 € /m²(88 m²)
Sale
House
5 rooms
88 m2
Land
633 m2
-Sols
Land
629 m2
-Vergers
Land
179 m2
-Jardins
Land
40 m2
-Sols
Land
90 m2
-Vergers
2023-10-23
161 000 €1 626 € /m²(99 m²)
Sale
House
5 rooms
99 m2
Land
480 m2
-Sols
Land
5660 m2
-Prés
Land
1250 m2
-Vergers
Land
1250 m2
-Prés
2023-09-13
42 770 €Sale
Land
611 m2
-Terrains à bâtir
2023-07-28
234 000 €1 500 € /m²(156 m²)
Sale
House
5 rooms
156 m2
Land
708 m2
-Sols
Land
826 m2
-Vergers
Land
35 m2
-Sols
Land
90 m2
-Vergers
2023-07-25
1 000 €Sale
Land
1245 m2
-Landes
/Pâture plantée
Land
1430 m2
-Landes
/Pâture plantée
Land
1250 m2
-Taillis sous futaie
Land
4810 m2
-Landes
/Pâture plantée
Land
730 m2
-Landes
/Pâture plantée
2023-06-21
750 €Sale
Land
220 m2
-Jardins
Land
210 m2
-Jardins
2023-06-02
15 000 €Sale
Land
4360 m2
-Taillis sous futaie
2023-03-23
75 000 €735 € /m²(102 m²)
Sale
House
4 rooms
102 m2
Land
748 m2
-Sols
157 transactions listed in the municipality
Compare with neighboring municipalities
City
name
name
house
Price per m²
Price per m²
apt.
Price per m²
Price per m²
City information
Zip codes
- 25150 DAMBELIN
- MAMBOUHANS 25150 DAMBELIN
Data source & update
- Latest publication of the property value request (DVF) database made available by the DGFiP on October 19, 2025, covering transactions up to 06/30/2025:
- Administrative/cadastral division as of September 1, 2025, and municipal movements as of January 1, 2025: