emooki
HomePrice mapTransactions
🇬🇧 English🇫🇷 Français🇩🇪 Deutsch🇪🇸 Español🇮🇹 Italiano

Real estate price map


Real estate price map in the municipality of Mérinchal.

Creuse (23)
Mérinchal

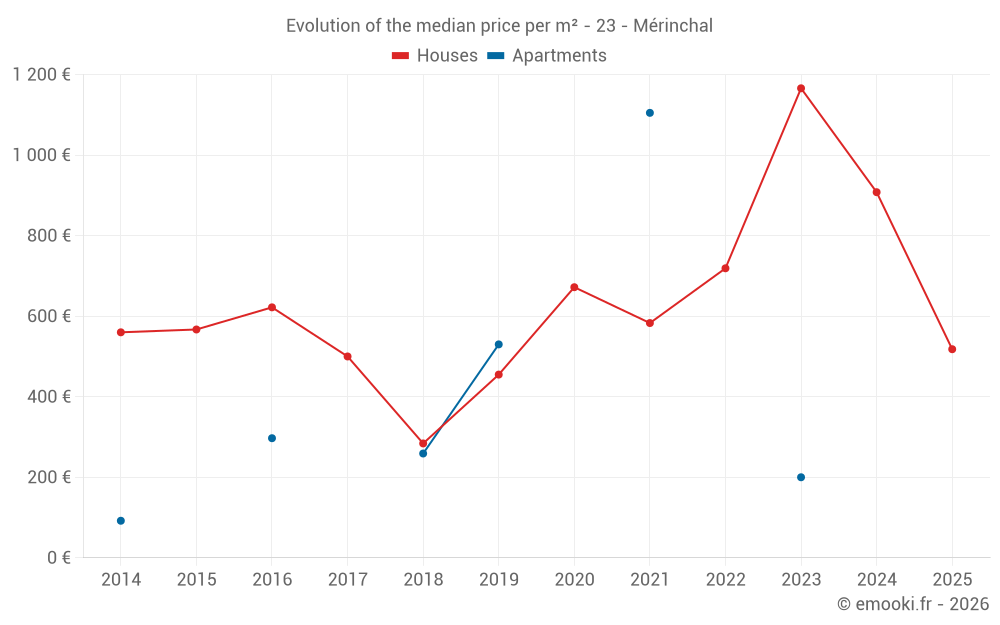
Median price of real estate
in the municipality of Mérinchal

HousesHouses
803  /m²
1-23-45-67-89-10
Reliability 7/10
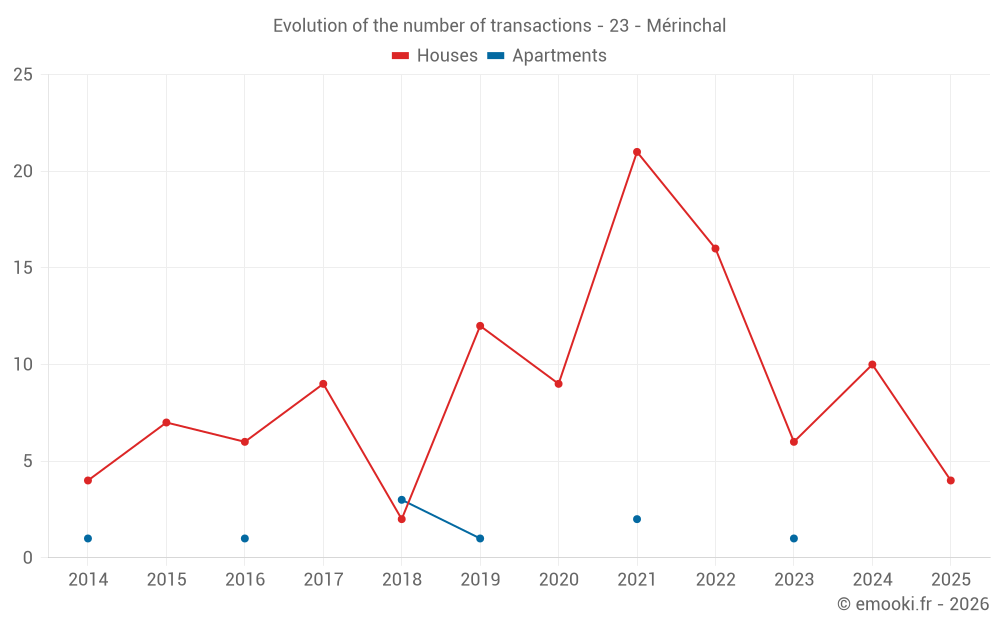
Median price on the 16 transactions of the last 24 months.
from 500 to
1 071  /m²
60% of transactions from the 2nd to the 8th deciles.
ApartmentsApartments
398  /m²
1-23-45-67-89-10
Reliability 2/10
Median price on the 7 transactions of the last 96 months.
DwellingsDwellings
766  /m²
1-23-45-67-89-10
Reliability 7/10
Median price on the 17 transactions of the last 24 months.
from 477 to
1 070  /m²
60% of transactions from the 2nd to the 8th deciles.
HousesEvolution of the price per m² of houses since...
1 year
--
2 years
--
3 years
--
4 years
--
5 years
--
6 years
--
7 years
--
8 years
--
9 years
--
10 years
--
11 years
--
ApartmentsEvolution of the price per m² of apartments since...
1 year
--
2 years
--
3 years
--
4 years
--
5 years
--
6 years
--
7 years
--
8 years
--
9 years
--
10 years
--
11 years
--

Yearly evolution

Evolution of the median price per m²

Evolution of the number of transactions

Warning, last year incomplete. Projections made based on the proportions between semesters of the previous year at the departmental/national level and by type of property.

Yearly data

Descending order
Year
Houses
house
transactions
Houses
house
Price per m²
Apartments
apt.
transactions
Apartments
apt.
Price per m²
2025
4
518 
0
--- 
2024
10
908 
0
--- 
2023
6
1 166 
1
200 
2022
16
719 
0
--- 
2021
21
583 
2
1 105 
2020
9
672 
0
--- 
2019
12
455 
1
530 
2018
2
284 
3
259 
2017
9
500 
0
--- 
2016
6
622 
1
297 
2015
7
567 
0
--- 
2014
4
560 
1
92 

Analysis

Structure of prices per m²

Values of price percentiles per m² over the periods used for the estimated price of each type of property.

Structure of transaction amounts

Values of transaction amounts percentiles over the periods used for the estimated price of each type of property.

Transaction amounts and prices per m² by percentile

Ascending order
Percentile
Houses
house
Price per m²
Houses
house
Transaction amount
Apartments
apt.
Price per m²
Apartments
apt.
Transaction amount
10th percentile
400 
25 000 
196 
24 700 
20th percentile
500 
38 000 
212 
27 200 
30th percentile
610 
53 750 
247 
29 300 
40th percentile
727 
64 000 
315 
35 200 
50th percentile
803 
74 091 
398 
43 000 
60th percentile
976 
80 000 
477 
43 630 
70th percentile
1 030 
87 800 
627 
50 540 
80th percentile
1 071 
100 K
918 
70 010 
90th percentile
1 380 
139 K
1 087 
87 700 

National and departmental comparison

Evolution of the median price per m² of houses

Evolution of the median price per m² of apartments

Quarterly evolution

Evolution of the median price per m²

Evolution of the number of transactions

Quarterly data

Descending order
Quarter
Houses
house
transactions
Houses
house
Price per m²
Apartments
apt.
transactions
Apartments
apt.
Price per m²
2025 Q2
1
565 
0
--- 
2025 Q1
3
471 
0
--- 
2024 Q4
3
656 
0
--- 
2024 Q3
2
3 822 
0
--- 
2024 Q2
3
840 
0
--- 
2024 Q1
2
1 169 
0
--- 
2023 Q4
2
1 090 
1
200 
2023 Q2
2
2 742 
0
--- 
2023 Q1
2
774 
0
--- 
2022 Q4
4
546 
0
--- 
2022 Q3
4
783 
0
--- 
2022 Q2
3
880 
0
--- 
2022 Q1
5
987 
0
--- 
2021 Q4
6
620 
0
--- 
2021 Q3
10
564 
0
--- 
2021 Q2
4
543 
0
--- 
2021 Q1
1
600 
2
1 105 
2020 Q4
3
691 
0
--- 
2020 Q3
2
546 
0
--- 
2020 Q2
2
1 096 
0
--- 
2020 Q1
2
1 007 
0
--- 
2019 Q4
1
483 
0
--- 
2019 Q3
5
533 
0
--- 
2019 Q2
3
136 
1
530 
2019 Q1
3
427 
0
--- 
2018 Q4
0
--- 
1
259 
2018 Q3
1
267 
1
398 
2018 Q2
1
300 
0
--- 
2018 Q1
0
--- 
1
190 
2017 Q4
2
394 
0
--- 
2017 Q3
3
600 
0
--- 
2017 Q2
3
583 
0
--- 
2017 Q1
1
277 
0
--- 
2016 Q4
3
948 
0
--- 
2016 Q3
1
549 
0
--- 
2016 Q2
0
--- 
1
297 
2016 Q1
2
403 
0
--- 
2015 Q4
3
1 452 
0
--- 
2015 Q3
2
662 
0
--- 
2015 Q2
1
455 
0
--- 
2015 Q1
1
250 
0
--- 
2014 Q4
3
569 
0
--- 
2014 Q3
0
--- 
1
92 
2014 Q2
1
550 
0
--- 

Creuse (23)

Most expensive cities

City
name
Descending orderHouses
house
Price per m²
1 433 
1 334 
1 316 
1 258 
1 176 
1 174 
1 164 
1 154 
1 154 
City
name
Descending orderApartments
apt.
Price per m²
1 356 
1 199 
1 085 
1 071 
1 037 

Least expensive cities

City
name
Ascending orderHouses
house
Price per m²
312 
438 
444 
462 
City
name
Ascending orderApartments
apt.
Price per m²
127 
128 
160 
170 
177 
180