emooki
HomePrice mapTransactions
🇬🇧 English🇫🇷 Français🇩🇪 Deutsch🇪🇸 Español🇮🇹 Italiano

Real estate price map


Real estate price map in the Creuse department.

Department 23
Creuse

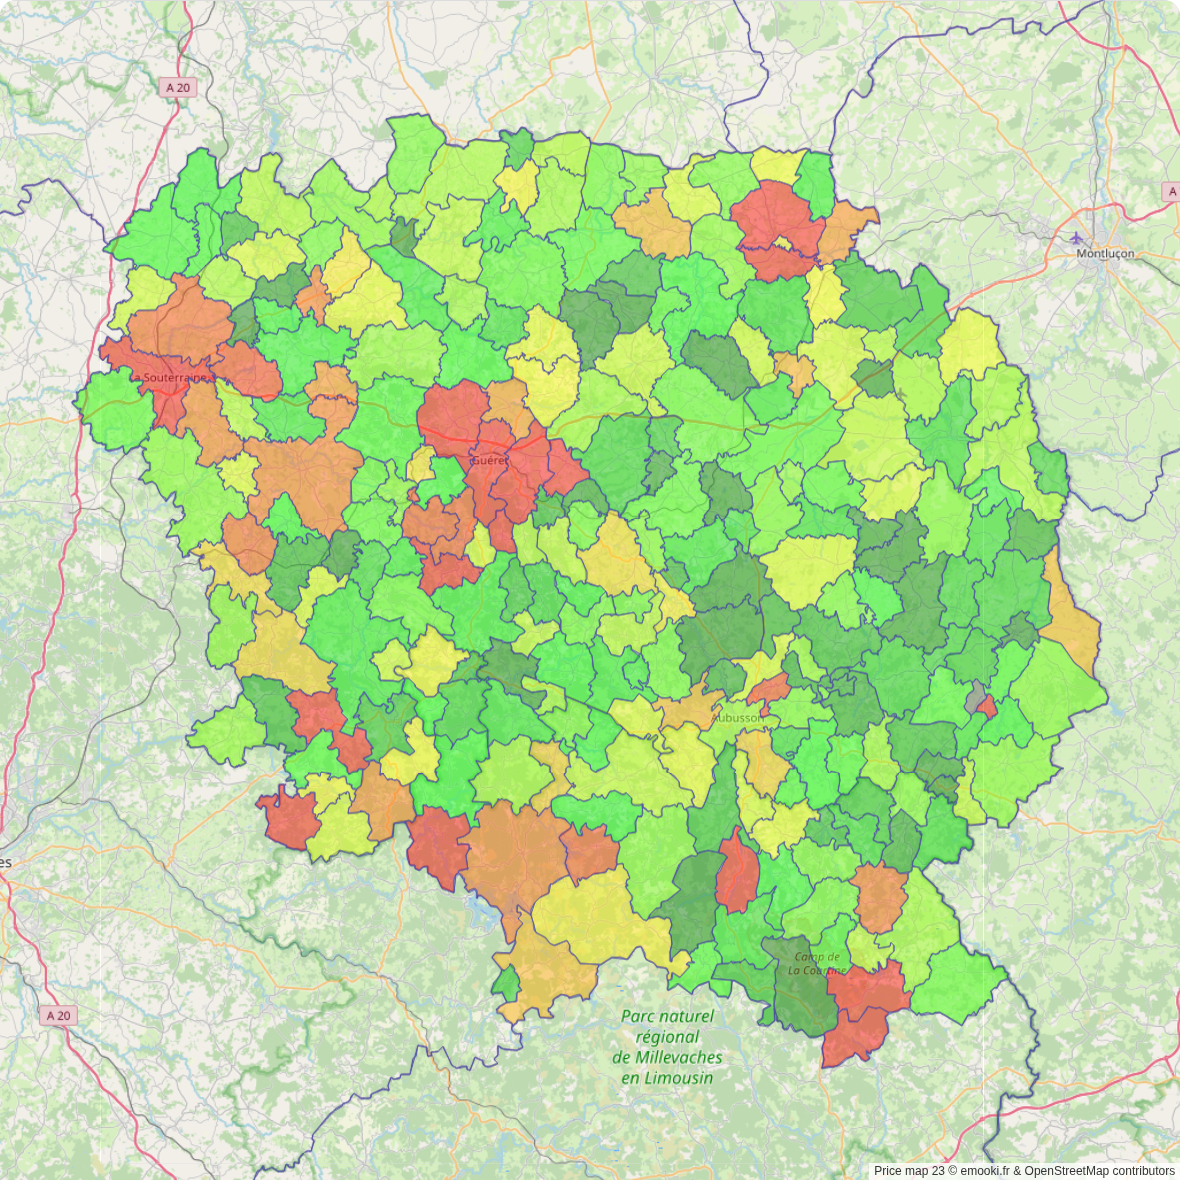
Median price of real estate
in the Creuse department

HousesHouses
806 € /m²
1-23-45-67-89-10
Reliability 10/10
Median price on the 372 transactions of the last 3 months.
from 352 to
1 335 € /m²
60% of transactions from the 2nd to the 8th deciles.
ApartmentsApartments
725 € /m²
1-23-45-67-89-10
Reliability 8/10
Median price on the 145 transactions of the last 12 months.
from 383 to
1 152 € /m²
60% of transactions from the 2nd to the 8th deciles.
DwellingsDwellings
817 € /m²
1-23-45-67-89-10
Reliability 10/10
Median price on the 407 transactions of the last 3 months.
from 373 to
1 335 € /m²
60% of transactions from the 2nd to the 8th deciles.
HousesEvolution of the price per m² of houses since...
1 year
-3.2%
2 years
+0.5%
3 years
+4.3%
4 years
+13%
5 years
+19%
6 years
+22%
7 years
+20%
8 years
+15%
9 years
+16%
10 years
+15%
11 years
+5.5%
ApartmentsEvolution of the price per m² of apartments since...
1 year
+24%
2 years
+5.1%
3 years
+32%
4 years
+42%
5 years
+29%
6 years
+24%
7 years
+30%
8 years
+17%
9 years
+37%
10 years
+35%
11 years
+17%

Yearly evolution

Evolution of the median price per m²

Evolution of the number of transactions

Warning, last year incomplete. Projections made based on the proportions between semesters of the previous year at the departmental/national level and by type of property.

Yearly data

Descending order
Year
Houses
house
transactions
Houses
house
Price per m²
Apartments
apt.
transactions
Apartments
apt.
Price per m²
2025
774
806 €
66
824 €
2024
1 828
833 €
151
667 €
2023
2 002
802 €
149
784 €
2022
2 296
773 €
190
626 €
2021
2 389
713 €
191
580 €
2020
1 881
676 €
118
638 €
2019
1 745
662 €
140
665 €
2018
1 548
669 €
119
633 €
2017
1 519
703 €
104
704 €
2016
1 415
694 €
90
603 €
2015
1 296
700 €
89
609 €
2014
1 164
764 €
82
702 €

Analysis

Structure of prices per m²

Values of price percentiles per m² over the periods used for the estimated price of each type of property.

Structure of transaction amounts

Values of transaction amounts percentiles over the periods used for the estimated price of each type of property.

Transaction amounts and prices per m² by percentile

Ascending order
Percentile
Houses
house
Price per m²
Houses
house
Transaction amount
Apartments
apt.
Price per m²
Apartments
apt.
Transaction amount
10th percentile
219 €
15 583 €
221 €
22 000 €
20th percentile
352 €
28 800 €
383 €
30 000 €
30th percentile
509 €
42 500 €
497 €
40 000 €
40th percentile
635 €
55 380 €
631 €
50 673 €
50th percentile
806 €
69 500 €
725 €
58 600 €
60th percentile
938 €
82 864 €
834 €
68 000 €
70th percentile
1 110 €
108 K€
1 030 €
79 740 €
80th percentile
1 335 €
132 K€
1 152 €
93 300 €
90th percentile
1 670 €
165 K€
1 329 €
120 K€

Quarterly evolution

Evolution of the median price per m²

Evolution of the number of transactions

Quarterly data

Descending order
Quarter
Houses
house
transactions
Houses
house
Price per m²
Apartments
apt.
transactions
Apartments
apt.
Price per m²
2025 Q2
372
806 €
35
886 €
2025 Q1
402
804 €
31
700 €
2024 Q4
516
852 €
48
662 €
2024 Q3
458
860 €
31
629 €
2024 Q2
435
770 €
36
670 €
2024 Q1
419
803 €
36
732 €
2023 Q4
528
780 €
42
748 €
2023 Q3
498
858 €
36
768 €
2023 Q2
470
800 €
31
766 €
2023 Q1
506
800 €
40
870 €
2022 Q4
562
769 €
54
625 €
2022 Q3
654
802 €
43
675 €
2022 Q2
581
750 €
41
598 €
2022 Q1
499
761 €
52
687 €
2021 Q4
647
747 €
48
610 €
2021 Q3
611
701 €
53
636 €
2021 Q2
601
722 €
43
534 €
2021 Q1
530
679 €
47
562 €
2020 Q4
699
690 €
42
628 €
2020 Q3
476
633 €
24
553 €
2020 Q2
354
670 €
24
846 €
2020 Q1
352
687 €
28
616 €
2019 Q4
499
661 €
28
680 €
2019 Q3
443
667 €
37
667 €
2019 Q2
426
654 €
45
546 €
2019 Q1
377
669 €
30
710 €
2018 Q4
433
682 €
30
626 €
2018 Q3
422
720 €
25
436 €
2018 Q2
359
625 €
30
642 €
2018 Q1
334
676 €
34
679 €
2017 Q4
385
703 €
27
583 €
2017 Q3
411
690 €
27
503 €
2017 Q2
379
700 €
26
738 €
2017 Q1
344
730 €
24
843 €
2016 Q4
408
688 €
17
612 €
2016 Q3
387
684 €
26
664 €
2016 Q2
321
727 €
31
603 €
2016 Q1
299
694 €
16
502 €
2015 Q4
409
705 €
27
800 €
2015 Q3
337
717 €
25
412 €
2015 Q2
277
636 €
21
608 €
2015 Q1
273
750 €
16
694 €
2014 Q4
333
764 €
18
707 €
2014 Q3
326
743 €
22
704 €
2014 Q2
227
798 €
21
608 €
2014 Q1
278
772 €
21
741 €

Creuse (23)

Most expensive cities

City
name
Descending orderHouses
house
Price per m²
1 433 €
1 334 €
1 324 €
1 316 €
1 258 €
1 176 €
1 174 €
1 164 €
1 154 €
1 154 €
City
name
Descending orderApartments
apt.
Price per m²
1 517 €
1 356 €
1 199 €
1 085 €
1 071 €
1 037 €
972 €
909 €
865 €
860 €

Least expensive cities

City
name
Ascending orderHouses
house
Price per m²
204 €
312 €
405 €
438 €
444 €
459 €
462 €
City
name
Ascending orderApartments
apt.
Price per m²
42 €
127 €
128 €
160 €
170 €
177 €
180 €