emooki
HomePrice mapTransactions
🇬🇧 English🇫🇷 Français🇩🇪 Deutsch🇪🇸 Español🇮🇹 Italiano

Real estate price map


Real estate price map in the municipality of Peyrat-la-Nonière.

Creuse (23)
Peyrat-la-Nonière

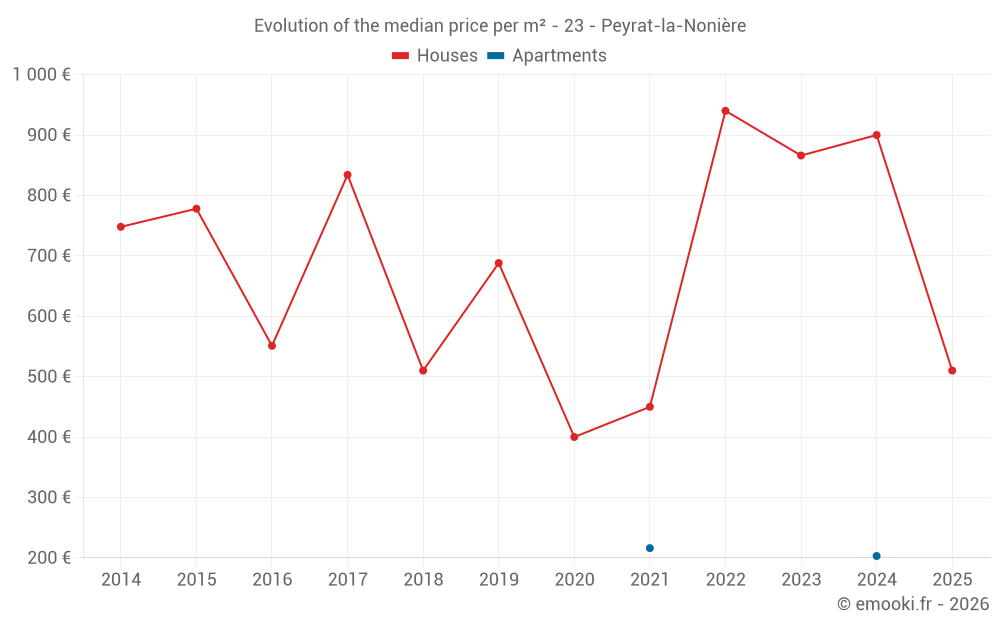
Median price of real estate
in the municipality of Peyrat-la-Nonière

HousesHouses
899  /m²
1-23-45-67-89-10
Reliability 7/10
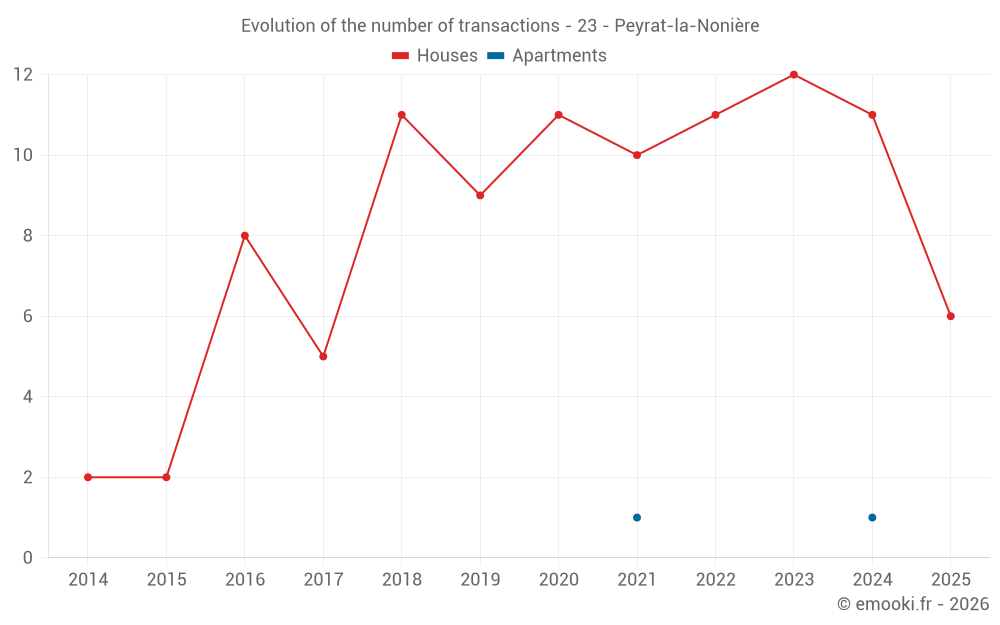
Median price on the 23 transactions of the last 24 months.
from 436 to
1 458  /m²
60% of transactions from the 2nd to the 8th deciles.
ApartmentsApartments
210  /m²
1-23-45-67-89-10
Reliability 1/10
Median price on the 2 transactions of the last 120 months.
DwellingsDwellings
862  /m²
1-23-45-67-89-10
Reliability 7/10
Median price on the 24 transactions of the last 24 months.
from 373 to
1 417  /m²
60% of transactions from the 2nd to the 8th deciles.
HousesEvolution of the price per m² of houses since...
1 year
-43%
2 years
-41%
3 years
-46%
4 years
+13%
5 years
+27%
6 years
-26%
7 years
0%
8 years
-39%
9 years
-7.4%
10 years
--
11 years
--
ApartmentsEvolution of the price per m² of apartments since...
1 year
--
2 years
--
3 years
--
4 years
--
5 years
--
6 years
--
7 years
--
8 years
--
9 years
--
10 years
--
11 years
--

Yearly evolution

Evolution of the median price per m²

Evolution of the number of transactions

Warning, last year incomplete. Projections made based on the proportions between semesters of the previous year at the departmental/national level and by type of property.

Yearly data

Descending order
Year
Houses
house
transactions
Houses
house
Price per m²
Apartments
apt.
transactions
Apartments
apt.
Price per m²
2025
6
510 
0
--- 
2024
11
900 
1
203 
2023
12
866 
0
--- 
2022
11
940 
0
--- 
2021
10
450 
1
216 
2020
11
400 
0
--- 
2019
9
688 
0
--- 
2018
11
510 
0
--- 
2017
5
834 
0
--- 
2016
8
551 
0
--- 
2015
2
778 
0
--- 
2014
2
748 
0
--- 

Analysis

Structure of prices per m²

Values of price percentiles per m² over the periods used for the estimated price of each type of property.

Structure of transaction amounts

Values of transaction amounts percentiles over the periods used for the estimated price of each type of property.

Transaction amounts and prices per m² by percentile

Ascending order
Percentile
Houses
house
Price per m²
Houses
house
Transaction amount
Apartments
apt.
Price per m²
Apartments
apt.
Transaction amount
10th percentile
331 
15 000 
204 
30 200 
20th percentile
436 
26 000 
206 
30 400 
30th percentile
503 
48 176 
207 
30 600 
40th percentile
548 
72 000 
208 
30 800 
50th percentile
899 
125 K
210 
31 000 
60th percentile
912 
135 K
211 
31 200 
70th percentile
1 171 
156 K
212 
31 400 
80th percentile
1 458 
167 K
213 
31 600 
90th percentile
1 757 
240 K
215 
31 800 

National and departmental comparison

Evolution of the median price per m² of houses

Evolution of the median price per m² of apartments

Quarterly evolution

Evolution of the median price per m²

Evolution of the number of transactions

Quarterly data

Descending order
Quarter
Houses
house
transactions
Houses
house
Price per m²
Apartments
apt.
transactions
Apartments
apt.
Price per m²
2025 Q2
3
1 303 
0
--- 
2025 Q1
3
333 
0
--- 
2024 Q4
3
900 
0
--- 
2024 Q3
2
1 342 
0
--- 
2024 Q2
5
899 
1
203 
2024 Q1
1
490 
0
--- 
2023 Q4
4
820 
0
--- 
2023 Q3
2
830 
0
--- 
2023 Q2
4
515 
0
--- 
2023 Q1
2
1 044 
0
--- 
2022 Q4
2
1 284 
0
--- 
2022 Q3
3
1 548 
0
--- 
2022 Q2
4
712 
0
--- 
2022 Q1
2
679 
0
--- 
2021 Q4
4
786 
0
--- 
2021 Q3
1
127 
0
--- 
2021 Q2
2
971 
1
216 
2021 Q1
3
357 
0
--- 
2020 Q4
3
339 
0
--- 
2020 Q3
3
825 
0
--- 
2020 Q2
2
493 
0
--- 
2020 Q1
3
320 
0
--- 
2019 Q4
2
836 
0
--- 
2019 Q3
2
480 
0
--- 
2019 Q2
2
938 
0
--- 
2019 Q1
3
600 
0
--- 
2018 Q4
4
520 
0
--- 
2018 Q3
5
418 
0
--- 
2018 Q2
1
331 
0
--- 
2018 Q1
1
771 
0
--- 
2017 Q4
2
926 
0
--- 
2017 Q3
1
435 
0
--- 
2017 Q2
1
1 883 
0
--- 
2017 Q1
1
834 
0
--- 
2016 Q4
3
420 
0
--- 
2016 Q3
2
496 
0
--- 
2016 Q2
1
769 
0
--- 
2016 Q1
2
786 
0
--- 
2015 Q1
2
778 
0
--- 
2014 Q4
1
559 
0
--- 
2014 Q1
1
938 
0
--- 

Creuse (23)

Most expensive cities

City
name
Descending orderHouses
house
Price per m²
1 433 
1 334 
1 316 
1 258 
1 176 
1 174 
1 164 
1 154 
1 154 
City
name
Descending orderApartments
apt.
Price per m²
1 356 
1 199 
1 085 
1 071 
1 037 

Least expensive cities

City
name
Ascending orderHouses
house
Price per m²
312 
438 
444 
462 
City
name
Ascending orderApartments
apt.
Price per m²
127 
128 
160 
170 
177 
180