emooki
HomePrice mapTransactions
🇬🇧 English🇫🇷 Français🇩🇪 Deutsch🇪🇸 Español🇮🇹 Italiano

Real estate price map


Real estate price map in the municipality of La Vergne, choose a section to see transactions by parcel.

Charente-Maritime (17)

La Vergne - Real estate price m²

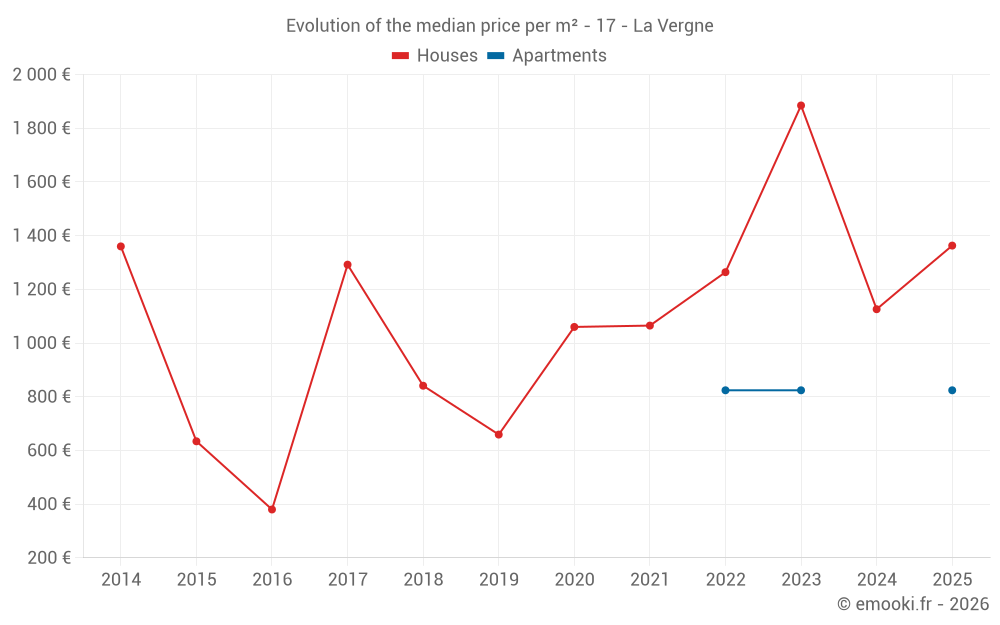
Median price of real estate
in the municipality of La Vergne

HousesHouses
1 418  /m²
1-23-45-67-89-10
Reliability 6/10
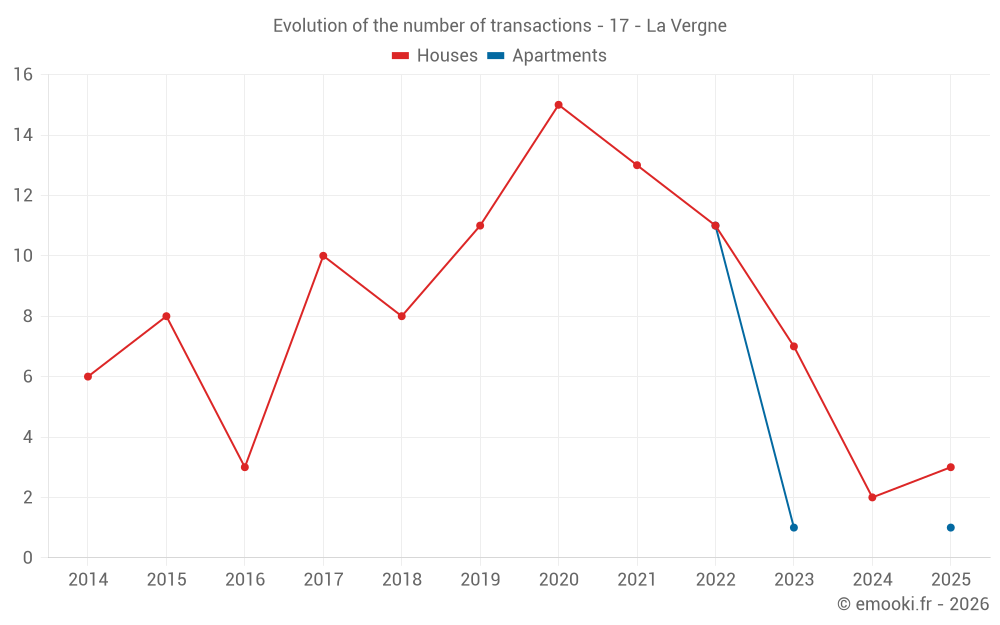
Median price on the 19 transactions of the last 36 months.
from 1 129 to
1 904  /m²
60% of transactions from the 2nd to the 8th deciles.
ApartmentsApartments
824  /m²
1-23-45-67-89-10
Reliability 6/10
Median price on the 12 transactions of the last 36 months.
from 824 to
965  /m²
60% of transactions from the 2nd to the 8th deciles.
DwellingsDwellings
1 113  /m²
1-23-45-67-89-10
Reliability 6/10
Median price on the 31 transactions of the last 36 months.
from 824 to
1 664  /m²
60% of transactions from the 2nd to the 8th deciles.

Yearly evolution

Evolution of the median price per m²

Evolution of the median price per m² - 17 - La Vergne

Evolution of the number of transactions

Warning, last year incomplete. Projections made based on the proportions between semesters of the previous year at the departmental/national level and by type of property.

Evolution of the number of transactions - 17 - La Vergne

Yearly data

Descending order
Year
Houses
house
transactions
Houses
house
Price per m²
Apartments
apt.
transactions
Apartments
apt.
Price per m²
2025
3
1 363 
1
824 
2024
2
1 126 
0
--- 
2023
7
1 885 
1
824 
2022
11
1 264 
11
824 
2021
13
1 065 
0
--- 
2020
15
1 060 
0
--- 
2019
11
659 
0
--- 
2018
8
841 
0
--- 
2017
10
1 292 
0
--- 
2016
3
380 
0
--- 
2015
8
634 
0
--- 
2014
6
1 360 
0
--- 

Analysis

Structure of prices per m²

Values of price percentiles per m² over the periods used for the estimated price of each type of property.

Structure of transaction amounts

Values of transaction amounts percentiles over the periods used for the estimated price of each type of property.

Transaction amounts and prices per m² by percentile

Ascending order
Percentile
Houses
house
Price per m²
Houses
house
Transaction amount
Apartments
apt.
Price per m²
Apartments
apt.
Transaction amount
10th percentile
1 026 
94 000 
390 
14 000 
20th percentile
1 129 
109 K
824 
14 000 
30th percentile
1 274 
127 K
824 
14 000 
40th percentile
1 367 
157 K
824 
18 400 
50th percentile
1 418 
168 K
824 
26 500 
60th percentile
1 624 
180 K
824 
28 000 
70th percentile
1 780 
198 K
824 
28 000 
80th percentile
1 904 
234 K
965 
28 000 
90th percentile
2 240 
314 K
1 000 
53 200 

National and departmental comparison

Evolution of the median price per m² of houses

Evolution of the median price per m² of apartments

Quarterly evolution

Evolution of the median price per m²

Evolution of the number of transactions

Quarterly data

Descending order
Quarter
Houses
house
transactions
Houses
house
Price per m²
Apartments
apt.
transactions
Apartments
apt.
Price per m²
2025 Q2
1
1 363 
1
824 
2025 Q1
2
1 467 
0
--- 
2024 Q4
1
1 139 
0
--- 
2024 Q2
1
1 113 
0
--- 
2023 Q4
1
1 056 
0
--- 
2023 Q3
1
2 689 
0
--- 
2023 Q2
2
2 006 
0
--- 
2023 Q1
3
1 857 
1
824 
2022 Q4
1
841 
1
342 
2022 Q3
6
1 400 
9
824 
2022 Q2
1
1 856 
1
732 
2022 Q1
3
1 063 
0
--- 
2021 Q4
7
1 267 
0
--- 
2021 Q3
3
933 
0
--- 
2021 Q2
1
1 271 
0
--- 
2021 Q1
2
414 
0
--- 
2020 Q4
2
715 
0
--- 
2020 Q3
7
1 060 
0
--- 
2020 Q2
4
924 
0
--- 
2020 Q1
2
1 778 
0
--- 
2019 Q4
3
867 
0
--- 
2019 Q2
6
381 
0
--- 
2019 Q1
2
1 160 
0
--- 
2018 Q4
2
1 278 
0
--- 
2018 Q3
2
744 
0
--- 
2018 Q2
3
977 
0
--- 
2018 Q1
1
235 
0
--- 
2017 Q4
2
1 018 
0
--- 
2017 Q3
5
1 346 
0
--- 
2017 Q2
1
967 
0
--- 
2017 Q1
2
1 302 
0
--- 
2016 Q3
2
302 
0
--- 
2016 Q1
1
825 
0
--- 
2015 Q4
2
528 
0
--- 
2015 Q2
3
680 
0
--- 
2015 Q1
3
776 
0
--- 
2014 Q4
1
1 264 
0
--- 
2014 Q3
1
1 963 
0
--- 
2014 Q2
2
956 
0
--- 
2014 Q1
2
1 600 
0
--- 

Overview of the latest real estate transactions

The following list is an anonymized overview of the latest transactions. For more details and to find all transactions, please use the map to view transactions by plot or the transaction search page for a search by criteria.

2025-04-30
218 000 
1 363  /m²(160 m²)
Sale
Houses
House
5 rooms
160 m2
2 outbuildings
Land
487 m2
-Sols
Land
28 m2
-Sols
2025-04-30
306 000 
827  /m²(370 m²)
Sale
Commercial property
370 m2
2025-04-11
14 000 
824  /m²(17 m²)
Sale
Apartments
Apartment
1 room
17 m2
2025-02-24
3 000 
Sale
Land
180 m2
-Terres
2025-02-24
3 000 
Sale
Land
179 m2
-Terres
2025-02-19
8 000 
Sale
Land
123 m2
-Sols
2025-01-27
107 000 
1 289  /m²(83 m²)
Sale
Houses
House
5 rooms
83 m2
Land
314 m2
-Sols
Land
131 m2
-Sols
Land
121 m2
-Sols
Land
77 m2
-Jardins
Land
4 m2
-Sols
2025-01-14
125 000 
1 645  /m²(76 m²)
Sale
Houses
House
3 rooms
76 m2
Land
602 m2
-Sols
Land
442 m2
-Jardins
2024-12-18
11 500 
Sale
Land
12 m2
-Sols
Land
108 m2
-Sols
2024-11-29
131 000 
1 139  /m²(115 m²)
Sale
Houses
House
5 rooms
115 m2
1 outbuilding
Land
1000 m2
-Sols
Land
166 m2
-Terrains d'agrément
2024-07-18
1 500 
Sale
Land
560 m2
-Taillis simples
Land
350 m2
-Taillis simples
Land
326 m2
-Taillis simples
2024-07-10
41 500 
Sale
Land
1660 m2
-Terrains d'agrément
2024-05-24
170 
Sale
Land
846 m2
-Landes
/Friche
2024-04-11
168 000 
1 113  /m²(151 m²)
Sale
Houses
House
4 rooms
151 m2
Land
1315 m2
-Sols
Land
207 m2
-Sols
2024-02-29
320 
Sale
Land
50 m2
-Sols
2024-01-17
3 033 
Sale
Land
36 m2
-Prés
Land
116 m2
-Bois
Land
94 m2
-Bois
Land
522 m2
-Jardins
Land
128 m2
-Jardins
Land
11 m2
-Sols
Land
51 m2
-Sols
2023-12-01
4 000 
Sale
Land
620 m2
-Jardins
Land
388 m2
-Jardins
2023-11-30
170 000 
1 133  /m²(150 m²)
Sale
Commercial property
150 m2
Land
1075 m2
-Terres
Land
1000 m2
-Sols
2023-11-28
95 000 
1 056  /m²(90 m²)
Sale
Houses
House
4 rooms
90 m2
Land
149 m2
-Sols
2023-11-22
172 000 
Sale
Land
297 m2
-Sols
253 transactions listed in the municipality

Charente-Maritime (17)

Most expensive cities

City
name
Descending orderHouses
house
Price per m²
7 719 
7 366 
6 940 
6 850 
6 566 
City
name
Descending orderApartments
apt.
Price per m²
7 889 
7 613 
7 059 
5 704 

Least expensive cities

City
name
Ascending orderHouses
house
Price per m²
598 
666 
704 
755 
City
name
Ascending orderApartments
apt.
Price per m²
140 
163 
302 
362 
404 
430