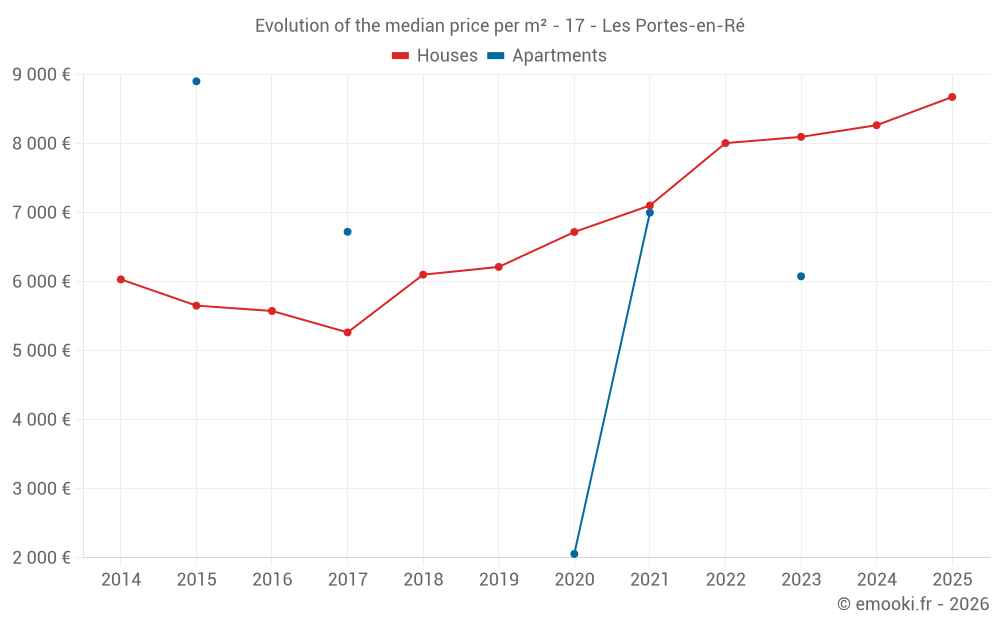
Median price of real estate
in the municipality of Les Portes-en-Ré
Houses
9 037 € /m²
Reliability 8/10
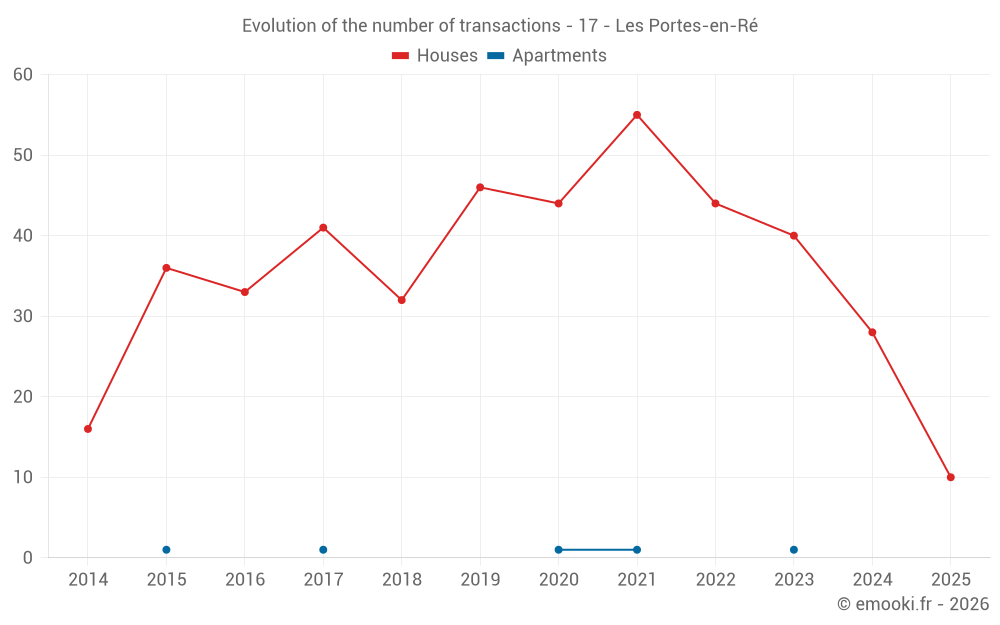
Median price on the 23 transactions of the last 12 months.
from 6 494 to
11 871 € /m²
11 871 € /m²
60% of transactions from the 2nd to the 8th deciles.
Apartments
6 400 € /m²
Reliability 1/10
Median price on the 4 transactions of the last 120 months.
Dwellings
9 037 € /m²
Reliability 8/10
Median price on the 23 transactions of the last 12 months.
from 6 494 to
11 871 € /m²
11 871 € /m²
60% of transactions from the 2nd to the 8th deciles.