emooki
HomePrice mapTransactions
🇬🇧 English🇫🇷 Français🇩🇪 Deutsch🇪🇸 Español🇮🇹 Italiano

Real estate price map


Real estate price map in the municipality of La Couarde-sur-Mer, choose a section to see transactions by parcel.

Charente-Maritime (17)

La Couarde-sur-Mer - Real estate price m²

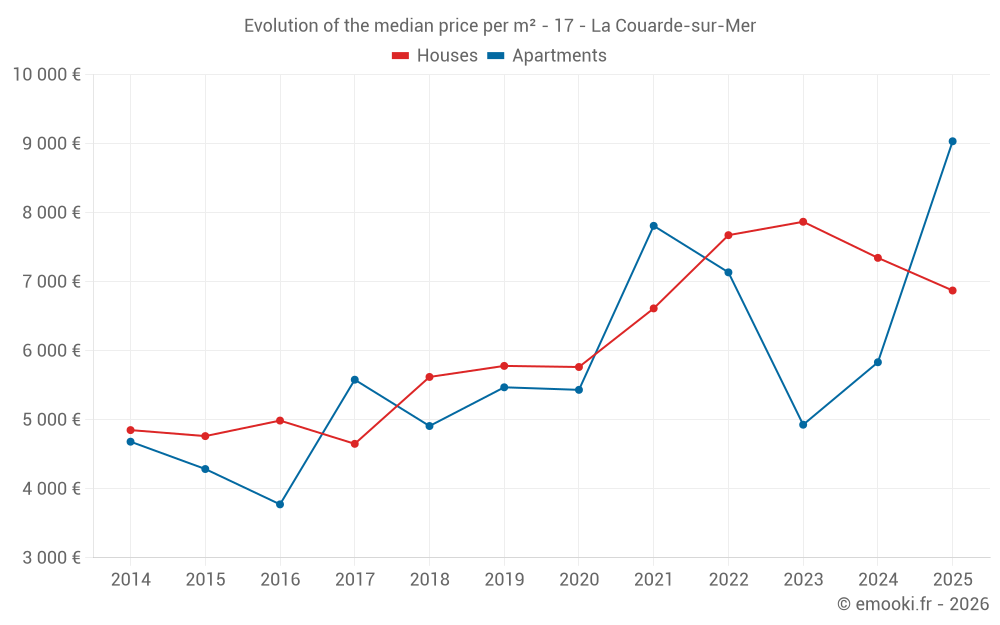
Median price of real estate
in the municipality of La Couarde-sur-Mer

HousesHouses
7 091  /m²
1-23-45-67-89-10
Reliability 8/10
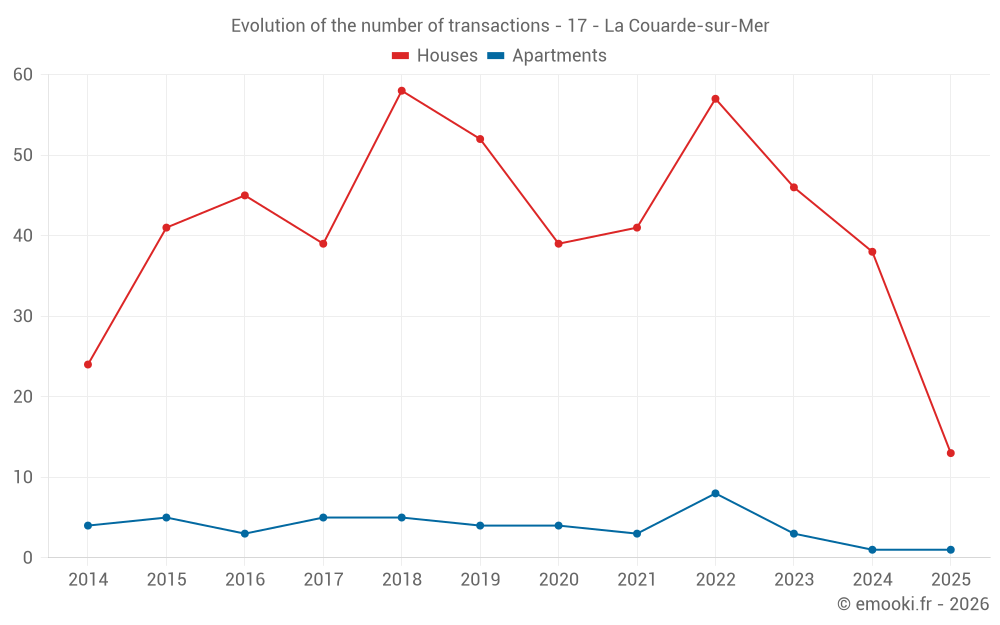
Median price on the 39 transactions of the last 12 months.
from 4 892 to
9 058  /m²
60% of transactions from the 2nd to the 8th deciles.
ApartmentsApartments
7 096  /m²
1-23-45-67-89-10
Reliability 5/10
Median price on the 14 transactions of the last 48 months.
from 5 122 to
8 165  /m²
60% of transactions from the 2nd to the 8th deciles.
DwellingsDwellings
7 170  /m²
1-23-45-67-89-10
Reliability 8/10
Median price on the 40 transactions of the last 12 months.
from 4 904 to
9 064  /m²
60% of transactions from the 2nd to the 8th deciles.
HousesEvolution of the price per m² of houses since...
1 year
-6.4%
2 years
-13%
3 years
-10%
4 years
+3.9%
5 years
+19%
6 years
+19%
7 years
+22%
8 years
+48%
9 years
+38%
10 years
+44%
11 years
+42%
The price per m² of houses has decreased by 13% since 2 years, but it has increased by 48% in 8 years.

Yearly evolution

Evolution of the median price per m²

Evolution of the median price per m² - 17 - La Couarde-sur-Mer

Evolution of the number of transactions

Warning, last year incomplete. Projections made based on the proportions between semesters of the previous year at the departmental/national level and by type of property.

Evolution of the number of transactions - 17 - La Couarde-sur-Mer

Yearly data

Descending order
Year
Houses
house
transactions
Houses
house
Price per m²
Apartments
apt.
transactions
Apartments
apt.
Price per m²
2025
13
6 872 
1
9 034 
2024
38
7 345 
1
5 833 
2023
46
7 868 
3
4 928 
2022
57
7 674 
8
7 135 
2021
41
6 613 
3
7 809 
2020
39
5 764 
4
5 433 
2019
52
5 780 
4
5 470 
2018
58
5 620 
5
4 909 
2017
39
4 651 
5
5 580 
2016
45
4 988 
3
3 774 
2015
41
4 763 
5
4 286 
2014
24
4 850 
4
4 682 

Analysis

Structure of prices per m²

Values of price percentiles per m² over the periods used for the estimated price of each type of property.

Structure of transaction amounts

Values of transaction amounts percentiles over the periods used for the estimated price of each type of property.

Transaction amounts and prices per m² by percentile

Ascending order
Percentile
Houses
house
Price per m²
Houses
house
Transaction amount
Apartments
apt.
Price per m²
Apartments
apt.
Transaction amount
10th percentile
3 033 
412 K
4 628 
160 K
20th percentile
4 892 
489 K
5 122 
176 K
30th percentile
6 337 
571 K
5 775 
180 K
40th percentile
6 846 
607 K
6 160 
188 K
50th percentile
7 091 
720 K
7 096 
214 K
60th percentile
7 356 
796 K
7 284 
240 K
70th percentile
8 330 
898 K
7 722 
264 K
80th percentile
9 058 
958 K
8 165 
279 K
90th percentile
10 590 
1 385 K
8 838 
322 K

National and departmental comparison

Evolution of the median price per m² of houses

Evolution of the median price per m² of apartments

Quarterly evolution

Evolution of the median price per m²

Evolution of the number of transactions

Quarterly data

Descending order
Quarter
Houses
house
transactions
Houses
house
Price per m²
Apartments
apt.
transactions
Apartments
apt.
Price per m²
2025 Q2
1
3 556 
0
--- 
2025 Q1
12
6 963 
1
9 034 
2024 Q4
14
7 345 
0
--- 
2024 Q3
12
6 968 
0
--- 
2024 Q2
8
8 154 
0
--- 
2024 Q1
4
6 916 
1
5 833 
2023 Q4
12
8 119 
0
--- 
2023 Q3
19
9 018 
1
4 928 
2023 Q2
10
7 082 
1
4 286 
2023 Q1
5
7 342 
1
7 222 
2022 Q4
18
7 402 
1
5 957 
2022 Q3
16
7 997 
2
6 110 
2022 Q2
17
7 025 
2
6 440 
2022 Q1
6
8 327 
3
7 689 
2021 Q4
11
6 212 
1
9 272 
2021 Q3
11
6 500 
0
--- 
2021 Q2
12
5 640 
0
--- 
2021 Q1
7
7 093 
2
5 904 
2020 Q4
15
6 314 
0
--- 
2020 Q3
6
4 672 
0
--- 
2020 Q2
8
5 891 
2
5 890 
2020 Q1
10
5 837 
2
5 137 
2019 Q4
15
5 957 
1
4 229 
2019 Q3
11
5 981 
1
5 250 
2019 Q2
11
4 762 
1
7 000 
2019 Q1
15
5 833 
1
5 690 
2018 Q4
19
5 444 
2
5 654 
2018 Q3
14
5 417 
1
4 909 
2018 Q2
11
6 169 
1
5 930 
2018 Q1
14
5 630 
1
4 895 
2017 Q4
13
4 872 
1
7 360 
2017 Q3
7
4 288 
1
5 391 
2017 Q2
9
4 493 
3
5 580 
2017 Q1
10
4 432 
0
--- 
2016 Q4
16
4 908 
0
--- 
2016 Q3
11
5 100 
0
--- 
2016 Q2
8
4 106 
2
3 478 
2016 Q1
10
5 624 
1
5 700 
2015 Q4
21
4 642 
1
4 286 
2015 Q3
8
5 232 
0
--- 
2015 Q2
1
3 869 
2
3 783 
2015 Q1
11
4 412 
2
4 586 
2014 Q4
11
4 706 
1
2 423 
2014 Q3
6
4 914 
1
4 820 
2014 Q2
1
5 000 
1
4 864 
2014 Q1
6
5 072 
1
4 545 

Overview of the latest real estate transactions

The following list is an anonymized overview of the latest transactions. For more details and to find all transactions, please use the map to view transactions by plot or the transaction search page for a search by criteria.

2025-06-12
30 000 
Sale
Land
160 m2
-Sols
2025-04-29
150 
Sale
Land
91 m2
-Vignes
2025-04-29
447 
Sale
Land
272 m2
-Vignes
2025-04-29
33 
Sale
Land
26 m2
-Terres
2025-04-28
1 594 
Sale
Land
745 m2
-Terres
Land
745 m2
-Jardins
2025-04-24
29 
Sale
Land
27 m2
-Sols
2025-04-24
544 000 
3 556  /m²(153 m²)
Sale
Houses
House
6 rooms
153 m2
1 outbuilding
Land
450 m2
-Sols
2025-04-22
41 700 
Sale
Land
300 m2
-Terres
2025-04-22
556 
Sale
Land
130 m2
-Terres
Land
390 m2
-Terres
2025-04-18
11 
Sale
Land
10 m2
-Sols
2025-04-17
195 000 
Sale
Land
500 m2
-Sols
Land
1980 m2
-Prés
Land
6440 m2
-Eaux
/Vivier
Land
630 m2
-Prés
Land
500 m2
-Sols
2025-04-16
165 000 
3 750  /m²(44 m²)
Sale
Commercial property
44 m2
2025-04-10
7 
Sale
Land
7 m2
-Sols
2025-04-03
98 
Sale
Land
92 m2
-Sols
2025-03-31
935 000 
7 248  /m²(129 m²)
Sale
Houses
House
5 rooms
129 m2
Land
532 m2
-Sols
Land
73 m2
-Sols
2025-03-31
2 308 
Sale
Land
1690 m2
-Terres
2025-03-31
872 800 
6 872  /m²(127 m²)
Sale
Houses
House
5 rooms
127 m2
Land
353 m2
-Sols
Land
200 m2
-Terres
Land
30 m2
-Terres
2025-03-25
57 
Sale
Land
53 m2
-Sols
2025-03-25
73 
Sale
Land
68 m2
-Sols
2025-03-24
10 
Sale
Land
9 m2
-Sols
858 transactions listed in the municipality

Charente-Maritime (17)

Most expensive cities

City
name
Descending orderHouses
house
Price per m²
7 719 
7 366 
6 940 
6 850 
6 566 
City
name
Descending orderApartments
apt.
Price per m²
7 889 
7 613 
7 059 
5 704 

Least expensive cities

City
name
Ascending orderHouses
house
Price per m²
598 
666 
704 
755 
City
name
Ascending orderApartments
apt.
Price per m²
140 
163 
302 
362 
404 
430