emooki
HomePrice mapTransactions
🇬🇧 English🇫🇷 Français🇩🇪 Deutsch🇪🇸 Español🇮🇹 Italiano

Real estate price map


Real estate price map in the municipality of Marennes-Hiers-Brouage, choose a section to see transactions by parcel.

Charente-Maritime (17)

Marennes-Hiers-Brouage - Real estate price m²

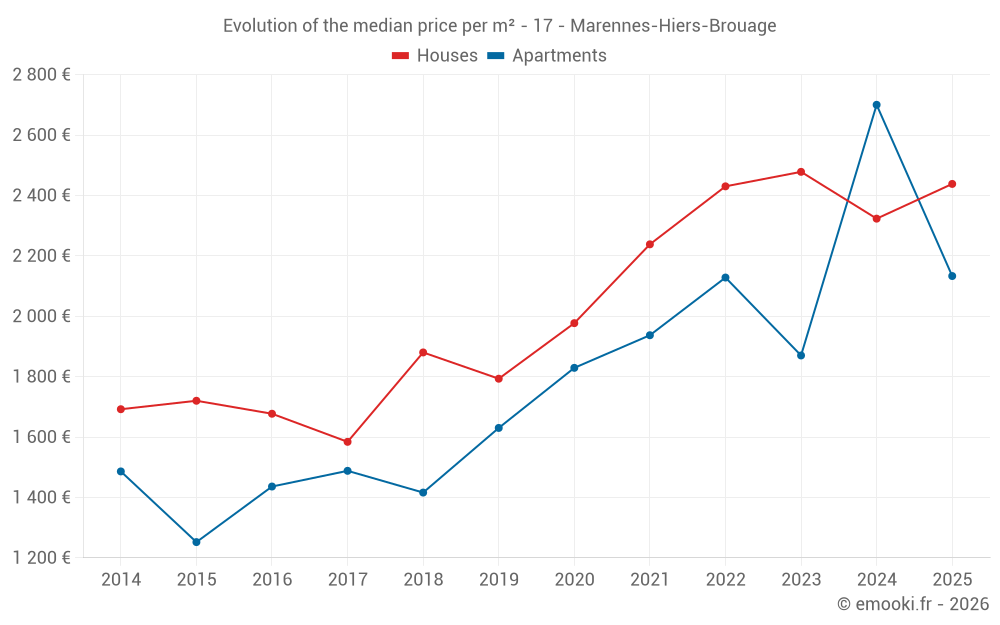
Median price of real estate
in the municipality of Marennes-Hiers-Brouage

HousesHouses
2 438  /m²
1-23-45-67-89-10
Reliability 9/10
Median price on the 39 transactions of the last 6 months.
from 1 792 to
3 095  /m²
60% of transactions from the 2nd to the 8th deciles.
ApartmentsApartments
2 458  /m²
1-23-45-67-89-10
Reliability 7/10
Median price on the 19 transactions of the last 24 months.
from 1 546 to
2 890  /m²
60% of transactions from the 2nd to the 8th deciles.
DwellingsDwellings
2 414  /m²
1-23-45-67-89-10
Reliability 9/10
Median price on the 42 transactions of the last 6 months.
from 1 808 to
3 074  /m²
60% of transactions from the 2nd to the 8th deciles.
HousesEvolution of the price per m² of houses since...
1 year
+5%
2 years
-1.6%
3 years
+0.3%
4 years
+8.9%
5 years
+23%
6 years
+36%
7 years
+30%
8 years
+54%
9 years
+45%
10 years
+42%
11 years
+44%
The price per m² of houses has decreased by 1.6% since 2 years, but it has increased by 54% in 8 years.

Yearly evolution

Evolution of the median price per m²

Evolution of the median price per m² - 17 - Marennes-Hiers-Brouage

Evolution of the number of transactions

Warning, last year incomplete. Projections made based on the proportions between semesters of the previous year at the departmental/national level and by type of property.

Evolution of the number of transactions - 17 - Marennes-Hiers-Brouage

Yearly data

Descending order
Year
Houses
house
transactions
Houses
house
Price per m²
Apartments
apt.
transactions
Apartments
apt.
Price per m²
2025
39
2 438 
3
2 133 
2024
89
2 323 
6
2 700 
2023
88
2 478 
17
1 870 
2022
108
2 430 
14
2 128 
2021
134
2 238 
10
1 937 
2020
119
1 977 
10
1 829 
2019
131
1 793 
9
1 630 
2018
114
1 880 
8
1 416 
2017
110
1 584 
4
1 488 
2016
92
1 677 
7
1 436 
2015
76
1 720 
4
1 252 
2014
66
1 692 
8
1 486 

Analysis

Structure of prices per m²

Values of price percentiles per m² over the periods used for the estimated price of each type of property.

Structure of transaction amounts

Values of transaction amounts percentiles over the periods used for the estimated price of each type of property.

Transaction amounts and prices per m² by percentile

Ascending order
Percentile
Houses
house
Price per m²
Houses
house
Transaction amount
Apartments
apt.
Price per m²
Apartments
apt.
Transaction amount
10th percentile
1 281 
81 000 
1 216 
85 090 
20th percentile
1 792 
128 K
1 546 
94 200 
30th percentile
2 062 
145 K
1 855 
100 K
40th percentile
2 170 
172 K
2 139 
106 K
50th percentile
2 438 
195 K
2 458 
110 K
60th percentile
2 604 
219 K
2 651 
114 K
70th percentile
2 854 
240 K
2 750 
129 K
80th percentile
3 095 
271 K
2 890 
147 K
90th percentile
3 198 
360 K
3 007 
190 K

National and departmental comparison

Evolution of the median price per m² of houses

Evolution of the median price per m² of apartments

Quarterly evolution

Evolution of the median price per m²

Evolution of the number of transactions

Quarterly data

Descending order
Quarter
Houses
house
transactions
Houses
house
Price per m²
Apartments
apt.
transactions
Apartments
apt.
Price per m²
2025 Q2
11
2 132 
1
1 929 
2025 Q1
28
2 444 
2
2 347 
2024 Q4
25
2 348 
1
2 727 
2024 Q3
24
2 269 
1
2 882 
2024 Q2
21
2 278 
3
2 674 
2024 Q1
19
2 349 
1
1 806 
2023 Q4
18
2 448 
5
1 484 
2023 Q3
32
2 532 
5
2 163 
2023 Q2
15
2 740 
2
1 828 
2023 Q1
23
2 329 
5
1 870 
2022 Q4
26
2 332 
5
2 054 
2022 Q3
35
2 500 
1
2 537 
2022 Q2
20
2 582 
7
1 902 
2022 Q1
27
2 262 
1
2 628 
2021 Q4
36
2 556 
4
2 168 
2021 Q3
26
2 222 
2
1 937 
2021 Q2
42
2 176 
3
1 728 
2021 Q1
30
2 080 
1
1 875 
2020 Q4
44
2 136 
5
1 695 
2020 Q3
27
2 195 
0
--- 
2020 Q2
25
1 768 
2
1 554 
2020 Q1
23
1 667 
3
1 958 
2019 Q4
32
1 842 
2
2 687 
2019 Q3
33
1 724 
3
1 643 
2019 Q2
34
1 816 
2
2 002 
2019 Q1
32
2 005 
2
1 348 
2018 Q4
28
1 625 
3
1 695 
2018 Q3
36
2 080 
2
1 224 
2018 Q2
28
1 880 
2
1 305 
2018 Q1
22
1 974 
1
1 581 
2017 Q4
25
1 567 
0
--- 
2017 Q3
32
1 462 
1
1 375 
2017 Q2
25
1 417 
0
--- 
2017 Q1
28
1 750 
3
1 600 
2016 Q4
24
1 910 
2
1 294 
2016 Q3
30
1 604 
2
1 168 
2016 Q2
21
1 490 
2
1 548 
2016 Q1
17
1 760 
1
1 686 
2015 Q4
17
1 597 
1
845 
2015 Q3
19
1 913 
0
--- 
2015 Q2
22
1 684 
3
1 659 
2015 Q1
18
1 630 
0
--- 
2014 Q4
20
1 755 
1
989 
2014 Q3
16
1 732 
2
1 264 
2014 Q2
8
1 681 
2
1 602 
2014 Q1
22
1 682 
3
1 435 

Overview of the latest real estate transactions

The following list is an anonymized overview of the latest transactions. For more details and to find all transactions, please use the map to view transactions by plot or the transaction search page for a search by criteria.

2025-06-27
3 000 
Sale
Land
9035 m2
-Terres
2025-06-27
330 000 
3 204  /m²(103 m²)
Sale
Houses
House
4 rooms
103 m2
Land
525 m2
-Jardins
Land
1000 m2
-Sols
2025-06-24
80 000 
transaction.nature.Vente terrain à bâtir
Land
400 m2
-Terres
2025-06-23
230 000 
3 194  /m²(72 m²)
Sale
Houses
House
3 rooms
72 m2
1 outbuilding
Land
518 m2
-Sols
2025-06-20
108 333 
1 667  /m²(65 m²)
Sale
Houses
House
3 rooms
65 m2
1 outbuilding
Land
182 m2
-Sols
2025-06-05
108 000 
1 929  /m²(56 m²)
Sale
Apartments
Apartment
3 rooms
56 m2
1 outbuilding
2025-06-05
145 000 
2 132  /m²(68 m²)
Sale
Houses
House
3 rooms
68 m2
Land
458 m2
-Sols
2025-06-02
6 000 
Sale
Land
30 m2
-Sols
2025-05-27
121 720 
transaction.nature.Vente terrain à bâtir
Land
269 m2
-Terres
Land
238 m2
-Terres
Land
209 m2
-Terres
2025-05-20
220 000 
3 188  /m²(69 m²)
Sale
Houses
House
4 rooms
69 m2
Land
423 m2
-Sols
Land
85 m2
-Sols
2025-05-16
240 000 
2 727  /m²(88 m²)
Sale
Houses
House
4 rooms
88 m2
Land
400 m2
-Sols
2025-05-05
346 984 
2 609  /m²(133 m²)
Sale
Houses
House
7 rooms
133 m2
1 outbuilding
Land
183 m2
-Sols
Land
36 m2
-Terrains à bâtir
Land
510 m2
-Sols
Land
128 m2
-Terrains à bâtir
Land
200 m2
-Terrains à bâtir
2025-05-05
60 000 
822  /m²(73 m²)
Sale
Houses
House
3 rooms
73 m2
Land
244 m2
-Sols
2025-05-05
290 000 
2 148  /m²(135 m²)
2 522  /m²(115 m²)
Sale
Houses
House
4 rooms
115 m2
Commercial property
20 m2
Land
107 m2
-Sols
2025-04-28
240 000 
2 105  /m²(114 m²)
Sale
Houses
House
4 rooms
114 m2
2 outbuildings
Land
692 m2
-Sols
2025-04-28
2 000 
Sale
Land
1375 m2
-Landes
/Pré marais
2025-04-24
45 520 
Sale
Land
4552 m2
-Terres
2025-04-11
52 400 
transaction.nature.Vente terrain à bâtir
Land
262 m2
-Terres
2025-04-11
42 840 
transaction.nature.Vente terrain à bâtir
Land
252 m2
-Terres
2025-04-08
65 000 
1 806  /m²(36 m²)
Sale
Houses
House
3 rooms
36 m2
2074 transactions listed in the municipality

Charente-Maritime (17)

Most expensive cities

City
name
Descending orderHouses
house
Price per m²
7 719 
7 366 
6 940 
6 850 
6 566 
City
name
Descending orderApartments
apt.
Price per m²
7 889 
7 613 
7 059 
5 704 

Least expensive cities

City
name
Ascending orderHouses
house
Price per m²
598 
666 
704 
755 
City
name
Ascending orderApartments
apt.
Price per m²
140 
163 
302 
362 
404 
430