emooki
HomePrice mapTransactions
🇬🇧 English🇫🇷 Français🇩🇪 Deutsch🇪🇸 Español🇮🇹 Italiano

Real estate price map


Real estate price map in the municipality of Échillais.

Charente-Maritime (17)
Échillais

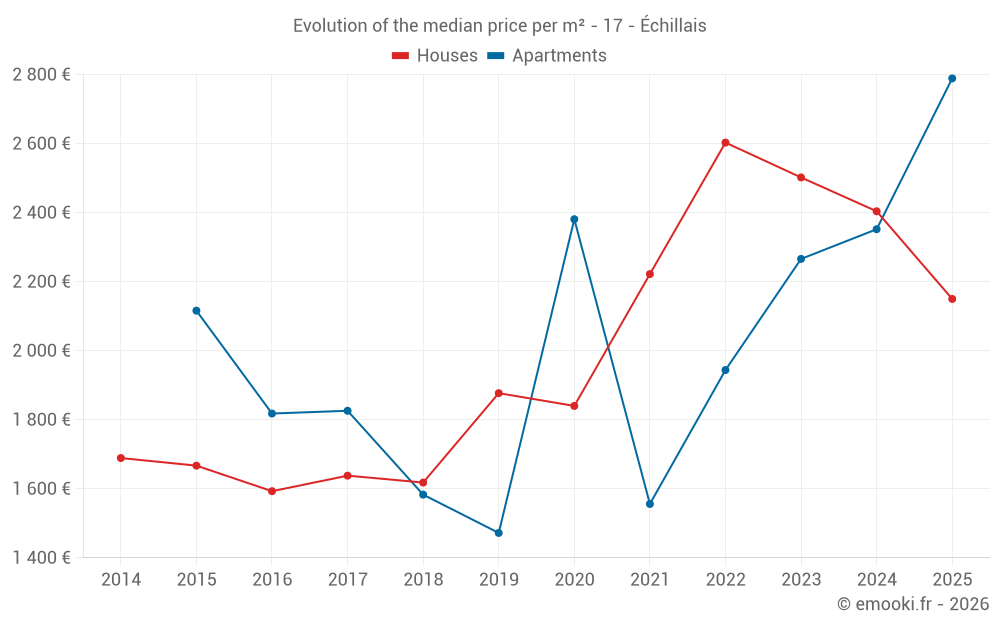
Median price of real estate
in the municipality of Échillais

HousesHouses
2 150  /m²
1-23-45-67-89-10
Reliability 9/10
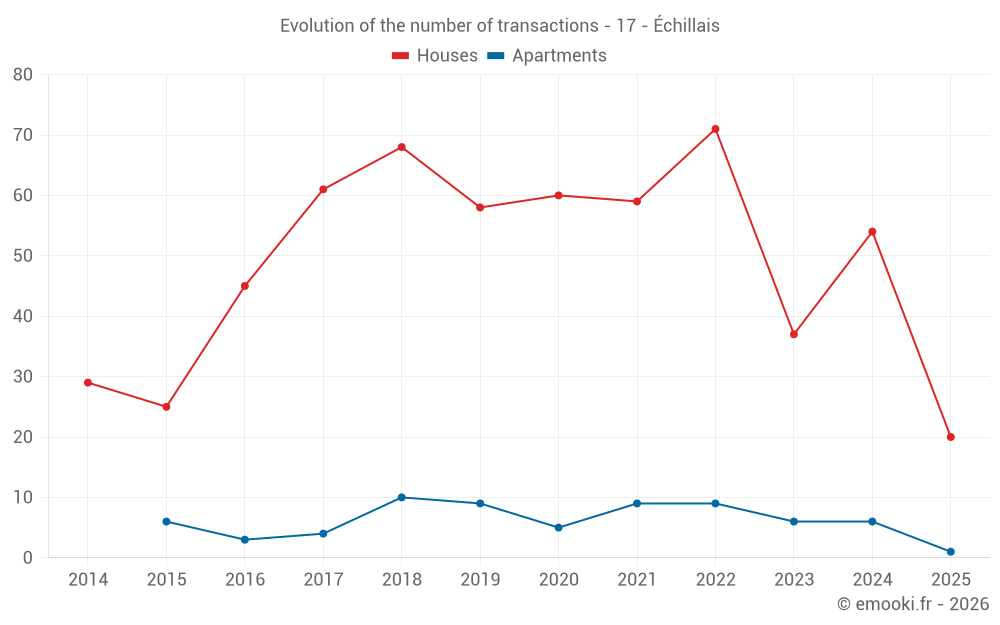
Median price on the 20 transactions of the last 6 months.
from 1 653 to
2 541  /m²
60% of transactions from the 2nd to the 8th deciles.
ApartmentsApartments
2 214  /m²
1-23-45-67-89-10
Reliability 6/10
Median price on the 16 transactions of the last 36 months.
from 2 046 to
2 648  /m²
60% of transactions from the 2nd to the 8th deciles.
DwellingsDwellings
2 173  /m²
1-23-45-67-89-10
Reliability 9/10
Median price on the 21 transactions of the last 6 months.
from 1 672 to
2 560  /m²
60% of transactions from the 2nd to the 8th deciles.
HousesEvolution of the price per m² of houses since...
1 year
-11%
2 years
-14%
3 years
-17%
4 years
-3.2%
5 years
+17%
6 years
+15%
7 years
+33%
8 years
+31%
9 years
+35%
10 years
+29%
11 years
+27%
ApartmentsEvolution of the price per m² of apartments since...
1 year
--
2 years
--
3 years
--
4 years
--
5 years
--
6 years
--
7 years
--
8 years
--
9 years
--
10 years
--
11 years
--

Yearly evolution

Evolution of the median price per m²

Evolution of the number of transactions

Warning, last year incomplete. Projections made based on the proportions between semesters of the previous year at the departmental/national level and by type of property.

Yearly data

Descending order
Year
Houses
house
transactions
Houses
house
Price per m²
Apartments
apt.
transactions
Apartments
apt.
Price per m²
2025
20
2 150 
1
2 789 
2024
54
2 404 
6
2 352 
2023
37
2 502 
6
2 266 
2022
71
2 603 
9
1 944 
2021
59
2 222 
9
1 556 
2020
60
1 840 
5
2 381 
2019
58
1 877 
9
1 472 
2018
68
1 618 
10
1 583 
2017
61
1 638 
4
1 826 
2016
45
1 593 
3
1 818 
2015
25
1 667 
6
2 116 
2014
29
1 689 
0
--- 

Analysis

Structure of prices per m²

Values of price percentiles per m² over the periods used for the estimated price of each type of property.

Structure of transaction amounts

Values of transaction amounts percentiles over the periods used for the estimated price of each type of property.

Transaction amounts and prices per m² by percentile

Ascending order
Percentile
Houses
house
Price per m²
Houses
house
Transaction amount
Apartments
apt.
Price per m²
Apartments
apt.
Transaction amount
10th percentile
1 457 
135 K
1 696 
83 120 
20th percentile
1 653 
160 K
2 046 
95 000 
30th percentile
1 986 
177 K
2 103 
114 K
40th percentile
2 042 
185 K
2 185 
126 K
50th percentile
2 150 
195 K
2 214 
133 K
60th percentile
2 308 
206 K
2 302 
140 K
70th percentile
2 397 
243 K
2 468 
142 K
80th percentile
2 541 
266 K
2 648 
143 K
90th percentile
2 621 
297 K
2 830 
150 K

National and departmental comparison

Evolution of the median price per m² of houses

Evolution of the median price per m² of apartments

Quarterly evolution

Evolution of the median price per m²

Evolution of the number of transactions

Quarterly data

Descending order
Quarter
Houses
house
transactions
Houses
house
Price per m²
Apartments
apt.
transactions
Apartments
apt.
Price per m²
2025 Q2
6
2 586 
1
2 789 
2025 Q1
14
2 092 
0
--- 
2024 Q4
16
2 398 
1
1 932 
2024 Q3
16
2 444 
4
2 401 
2024 Q2
13
2 273 
0
--- 
2024 Q1
9
2 537 
1
2 551 
2023 Q4
7
2 502 
1
2 385 
2023 Q3
8
2 630 
2
2 165 
2023 Q2
16
2 424 
1
2 231 
2023 Q1
6
2 442 
2
2 177 
2022 Q4
13
2 830 
3
2 185 
2022 Q3
31
2 644 
0
--- 
2022 Q2
13
2 321 
1
1 944 
2022 Q1
14
2 288 
5
1 778 
2021 Q4
17
2 316 
3
1 556 
2021 Q3
15
2 157 
2
1 700 
2021 Q2
14
2 308 
3
1 985 
2021 Q1
13
2 142 
1
1 296 
2020 Q4
15
1 760 
3
2 381 
2020 Q3
16
1 930 
0
--- 
2020 Q2
14
1 746 
1
2 833 
2020 Q1
15
1 778 
1
1 692 
2019 Q4
18
1 948 
2
1 573 
2019 Q3
14
1 912 
4
1 508 
2019 Q2
15
1 953 
2
1 486 
2019 Q1
11
1 775 
1
1 444 
2018 Q4
13
1 548 
3
1 551 
2018 Q3
34
1 744 
3
2 044 
2018 Q2
6
1 446 
1
1 411 
2018 Q1
15
1 579 
3
1 532 
2017 Q4
12
1 544 
0
--- 
2017 Q3
15
1 667 
0
--- 
2017 Q2
18
1 676 
2
1 608 
2017 Q1
16
1 587 
2
2 210 
2016 Q4
18
1 548 
2
1 755 
2016 Q3
7
1 463 
0
--- 
2016 Q2
11
1 739 
0
--- 
2016 Q1
9
1 557 
1
2 636 
2015 Q4
4
1 634 
0
--- 
2015 Q3
16
1 740 
0
--- 
2015 Q2
3
1 667 
3
1 333 
2015 Q1
2
635 
3
2 418 
2014 Q4
8
1 699 
0
--- 
2014 Q3
9
1 689 
0
--- 
2014 Q2
8
1 669 
0
--- 
2014 Q1
4
1 794 
0
--- 

Charente-Maritime (17)

Most expensive cities

City
name
Descending orderHouses
house
Price per m²
7 719 
7 366 
6 940 
6 850 
6 566 
City
name
Descending orderApartments
apt.
Price per m²
7 889 
7 613 
7 059 
5 704 

Least expensive cities

City
name
Ascending orderHouses
house
Price per m²
598 
666 
704 
755 
City
name
Ascending orderApartments
apt.
Price per m²
140 
163 
302 
362 
404 
430