emooki
HomePrice mapTransactions
🇬🇧 English🇫🇷 Français🇩🇪 Deutsch🇪🇸 Español🇮🇹 Italiano

Real estate price map


Real estate price map in the municipality of Le Château-d'Oléron.

Charente-Maritime (17)
Le Château-d'Oléron

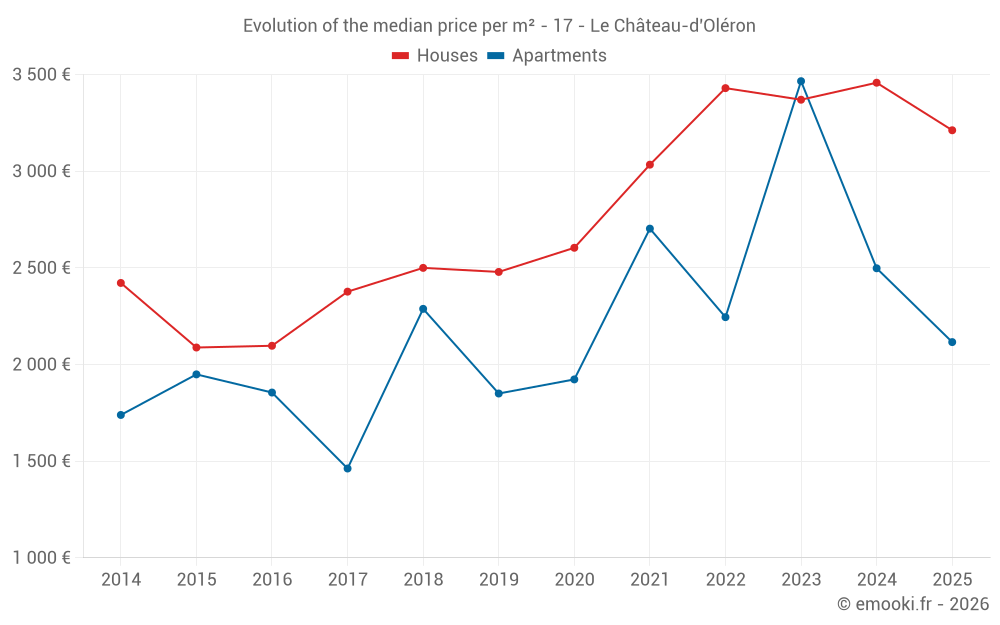
Median price of real estate
in the municipality of Le Château-d'Oléron

HousesHouses
3 212  /m²
1-23-45-67-89-10
Reliability 9/10
Median price on the 34 transactions of the last 6 months.
from 2 485 to
4 259  /m²
60% of transactions from the 2nd to the 8th deciles.
ApartmentsApartments
2 312  /m²
1-23-45-67-89-10
Reliability 6/10
Median price on the 15 transactions of the last 36 months.
from 1 965 to
3 148  /m²
60% of transactions from the 2nd to the 8th deciles.
DwellingsDwellings
3 140  /m²
1-23-45-67-89-10
Reliability 9/10
Median price on the 36 transactions of the last 6 months.
from 2 232 to
4 167  /m²
60% of transactions from the 2nd to the 8th deciles.
HousesEvolution of the price per m² of houses since...
1 year
-7.1%
2 years
-4.7%
3 years
-6.4%
4 years
+5.9%
5 years
+23%
6 years
+30%
7 years
+28%
8 years
+35%
9 years
+53%
10 years
+54%
11 years
+33%
ApartmentsEvolution of the price per m² of apartments since...
1 year
--
2 years
--
3 years
--
4 years
--
5 years
--
6 years
--
7 years
--
8 years
--
9 years
--
10 years
--
11 years
--

Yearly evolution

Evolution of the median price per m²

Evolution of the number of transactions

Warning, last year incomplete. Projections made based on the proportions between semesters of the previous year at the departmental/national level and by type of property.

Yearly data

Descending order
Year
Houses
house
transactions
Houses
house
Price per m²
Apartments
apt.
transactions
Apartments
apt.
Price per m²
2025
34
3 212 
2
2 116 
2024
68
3 458 
6
2 498 
2023
88
3 370 
2
3 466 
2022
108
3 430 
11
2 245 
2021
136
3 034 
11
2 703 
2020
86
2 604 
11
1 923 
2019
93
2 479 
10
1 850 
2018
87
2 500 
5
2 288 
2017
78
2 377 
5
1 462 
2016
77
2 097 
3
1 855 
2015
56
2 088 
5
1 949 
2014
45
2 422 
1
1 739 

Analysis

Structure of prices per m²

Values of price percentiles per m² over the periods used for the estimated price of each type of property.

Structure of transaction amounts

Values of transaction amounts percentiles over the periods used for the estimated price of each type of property.

Transaction amounts and prices per m² by percentile

Ascending order
Percentile
Houses
house
Price per m²
Houses
house
Transaction amount
Apartments
apt.
Price per m²
Apartments
apt.
Transaction amount
10th percentile
1 742 
153 K
1 685 
103 K
20th percentile
2 485 
176 K
1 965 
109 K
30th percentile
2 811 
209 K
2 058 
131 K
40th percentile
3 054 
216 K
2 240 
164 K
50th percentile
3 212 
232 K
2 312 
170 K
60th percentile
3 588 
265 K
2 765 
172 K
70th percentile
3 664 
305 K
2 966 
187 K
80th percentile
4 259 
366 K
3 148 
195 K
90th percentile
4 529 
446 K
3 341 
262 K

National and departmental comparison

Evolution of the median price per m² of houses

Evolution of the median price per m² of apartments

Quarterly evolution

Evolution of the median price per m²

Evolution of the number of transactions

Quarterly data

Descending order
Quarter
Houses
house
transactions
Houses
house
Price per m²
Apartments
apt.
transactions
Apartments
apt.
Price per m²
2025 Q2
10
4 028 
1
2 232 
2025 Q1
24
3 116 
1
2 000 
2024 Q4
21
3 462 
1
2 985 
2024 Q3
19
3 696 
2
1 864 
2024 Q2
10
3 437 
2
2 070 
2024 Q1
18
3 259 
1
3 266 
2023 Q4
11
3 372 
0
--- 
2023 Q3
20
2 982 
0
--- 
2023 Q2
34
3 059 
1
3 391 
2023 Q1
23
3 870 
1
3 542 
2022 Q4
20
3 529 
4
2 567 
2022 Q3
33
3 854 
1
1 590 
2022 Q2
24
3 180 
5
2 679 
2022 Q1
31
2 968 
1
1 840 
2021 Q4
39
3 589 
3
2 786 
2021 Q3
39
2 944 
2
2 314 
2021 Q2
26
2 872 
4
2 616 
2021 Q1
32
2 733 
2
2 790 
2020 Q4
32
2 688 
4
1 954 
2020 Q3
17
2 611 
2
1 562 
2020 Q2
16
2 676 
4
2 316 
2020 Q1
21
2 351 
1
667 
2019 Q4
17
2 615 
5
1 714 
2019 Q3
26
2 626 
3
1 793 
2019 Q2
24
2 514 
1
2 442 
2019 Q1
26
2 438 
1
1 908 
2018 Q4
23
2 297 
1
2 295 
2018 Q3
19
2 840 
2
2 396 
2018 Q2
25
2 727 
1
2 288 
2018 Q1
20
2 390 
1
1 850 
2017 Q4
20
2 432 
3
1 658 
2017 Q3
17
2 398 
0
--- 
2017 Q2
18
2 418 
2
1 281 
2017 Q1
23
2 299 
0
--- 
2016 Q4
26
2 174 
1
1 932 
2016 Q3
24
2 101 
1
600 
2016 Q2
14
2 161 
1
1 855 
2016 Q1
13
2 025 
0
--- 
2015 Q4
15
1 815 
2
1 229 
2015 Q3
10
2 128 
1
1 949 
2015 Q2
20
2 230 
0
--- 
2015 Q1
11
2 250 
2
2 900 
2014 Q4
15
2 611 
0
--- 
2014 Q3
13
2 267 
0
--- 
2014 Q2
8
1 591 
0
--- 
2014 Q1
9
2 774 
1
1 739 

Charente-Maritime (17)

Most expensive cities

City
name
Descending orderHouses
house
Price per m²
7 719 
7 366 
6 940 
6 850 
6 566 
City
name
Descending orderApartments
apt.
Price per m²
7 889 
7 613 
7 059 
5 704 

Least expensive cities

City
name
Ascending orderHouses
house
Price per m²
598 
666 
704 
755 
City
name
Ascending orderApartments
apt.
Price per m²
140 
163 
302 
362 
404 
430